for the public traded for the public traded company Facebook-FB inc, compute the gross profit percentage and the rate of inventory turnover for 2016,2017 and
for the public traded 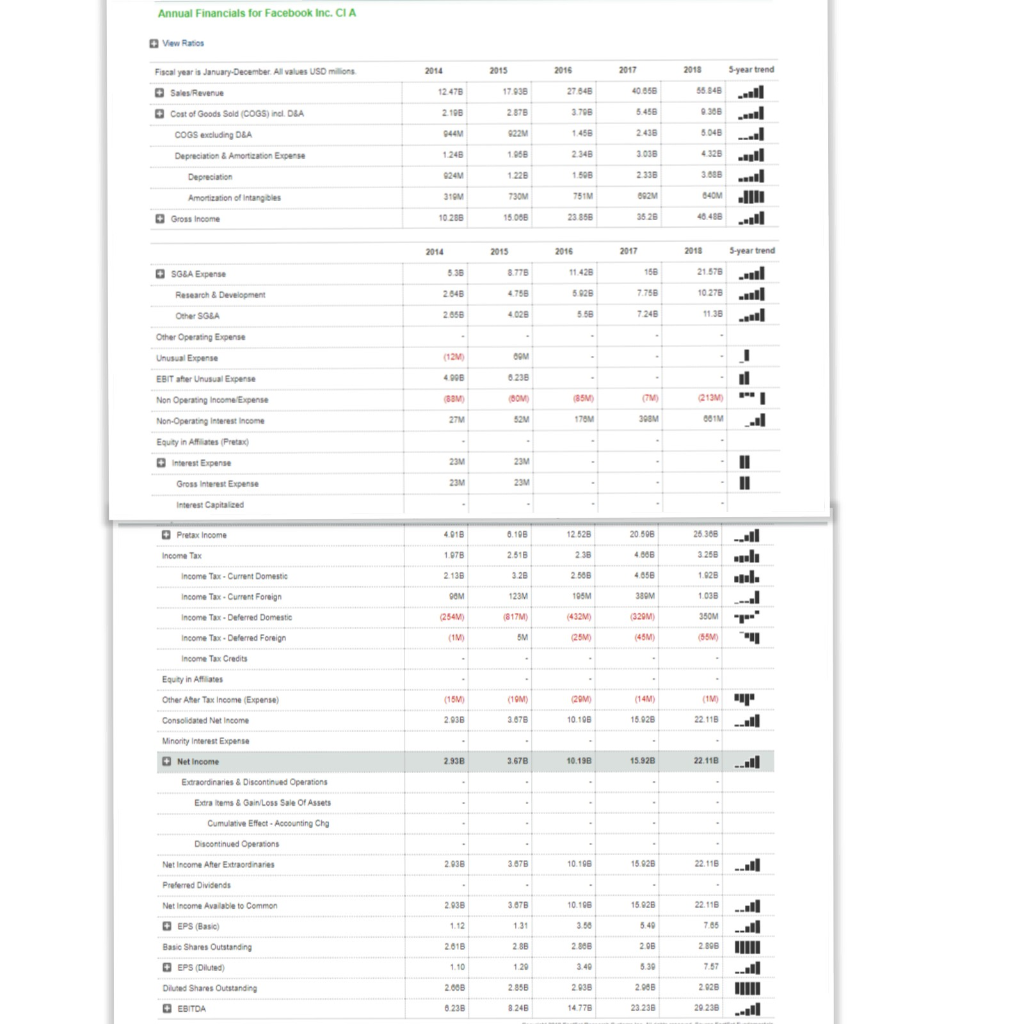
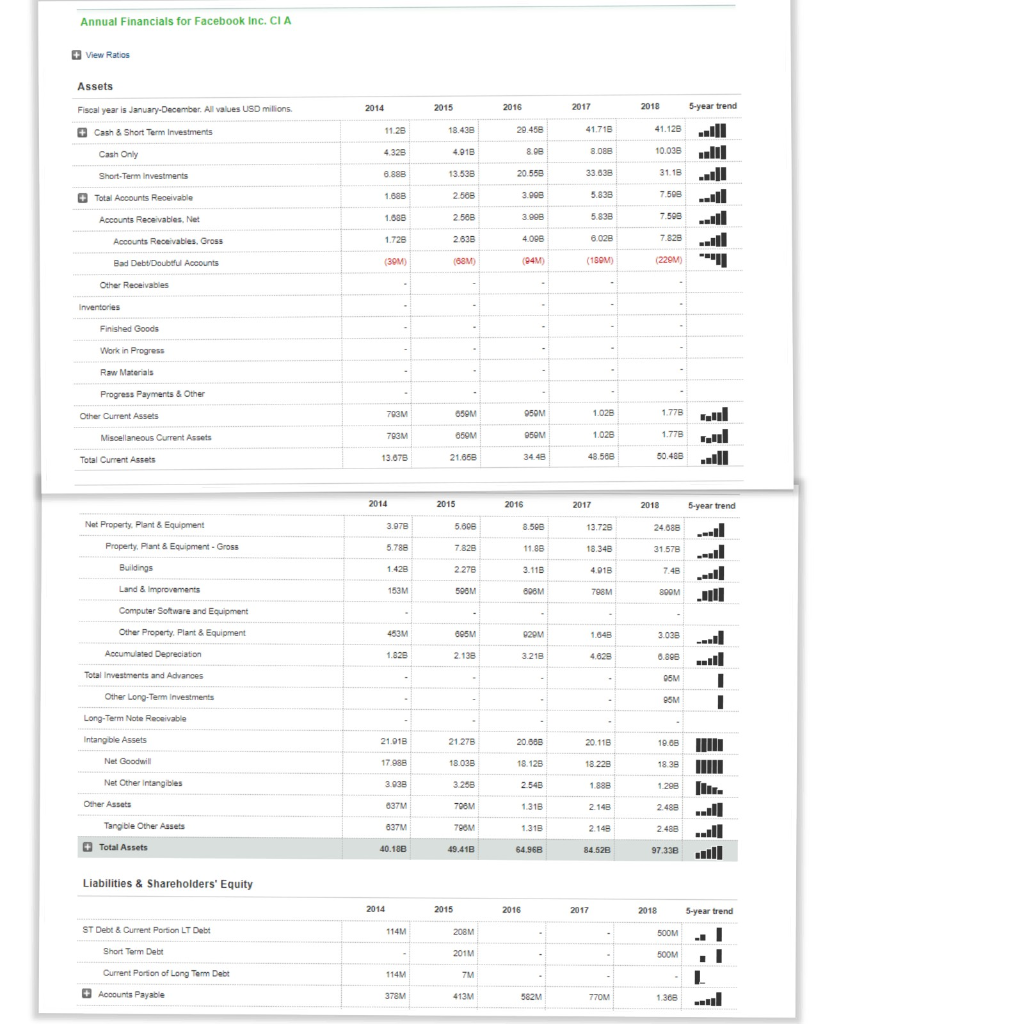
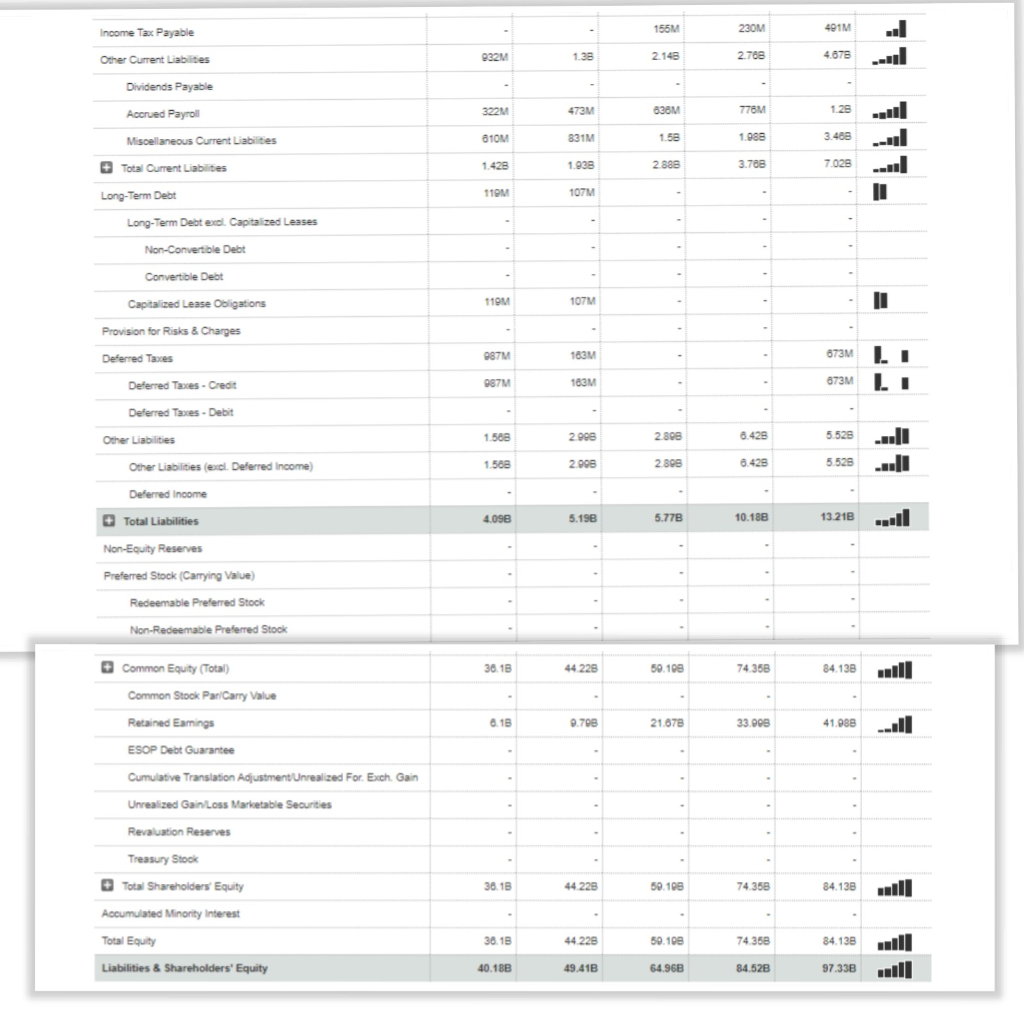 for the public traded company Facebook-FB inc, compute the gross profit percentage and the rate of inventory turnover for 2016,2017 and 2018.Identify the classes of stock that the company has issued.Which item carries a larger balance-the Common stock account or Paid-in-capital in excess of par (Additional paid in capital)?What restrictions are put on the additional paid in.Identify the intangibles assets that were owned by the company for 2016,2017 and 2018.If these assets have no visible form,why are they assets after all.Calculate the current Ratio,the Debt Ratio and the Acid-Test Ratio for 2016,2017 and 2018.Determine whether these ratios improved or deteriorated from 2016.
Annual Financials for Facebook Inc. CIA wew Rates Fiscal year is January-December. All values USO milion 2014 17 938 0 856 5 456 2 438 3.038 2336 55 848 308 5 048 432B 3.888 12 478 27 848 Cost of Goods Sold (COGS) incl. DBA 2108 3.708 COGS excluding D&A 1248 2348 1.228 310M 751M 10 288 15 088 23 858 35 26 40 488 S-year trend SG&A Expense 8778 758 028 Research & Development 2 048 928 7 756 0 278. Other SG&A 2 056 7 248 Other Operating Expense Unusual Expense EBIT aher Unusual Expense Non Operating Income Expense Non-Operating Interest Income Equity in Affiliaes (Preta 238 178M 01M Interest Expense Gross Interest Expense Interest Capitalized Pretax Incoome 2 528 ncome Tax 4 806 gal. Income Tax Current Domestic Income Tax-Current Foreign Income Tax-Deferred Domestic Income Tax-Deferred Foreign Income Tax Credits 1928 1038 350M 254V) -r. Equity in Afflate Other After Tax Income (Expense) Consolidated Net Income (15M 3.076 15 28 Net Income 2.93B 3.678 15.928 22.11B Extra Items&GainLoss Sale Of Asse CumulativeEffect Accounting Chg 0.196 15 926 Net Income After Extraordinaries Prelerred Dividends Net Income Avalable to Common EPS (Basic) Basic Shares Outstanding 2.038 3 676 15 28 22.116 2 806 EPS (Diluted) 28IIIIl 238 Diluted Shares Outstanding 2008 2 856 2 938 8 24B 4 776 23 236 Annual Financials for Facebook Inc. CIA View Ratios Assets 2016 2017 2018 5-year trend year is January-December. All values USD milions 41.12 0.038 29.458 11 28 4.328 6.888 1.688 1.088 1.728 8.438 4.918 3.538 2.568 2 588 2638 Cash & Short Term Investments 8.088 33.638 5.838 5 838 6 028 (159M) Cash Only 20.558 3.998 3.908 4.096 Short-Term Investments 7.508l 7508 7828 ..! Total Accounts Receivable Accounts Receivables, Net Accounts Receivabies, Gross Bad Debt Doubtful Accounts Finished Goods Raw Materials Progress Payments& Other 1.028 1.778 Other Current Assets 1.028 77B Miscellaneous Current Assets 48.568ll Total Current Assets 13.078 21.658 34.48 2015 2017 2018 5-year trend Not Property. Plant& Equipment 5.806 7.828 2 278 506M 8.586 11.88 3.11B 3.729 18.348 4.91B 798M 24.088 Property, Plant & Equipment-Gross 5.788 31.578 .428 153M Computer Software and Equipment Other Property. Plant & Equipment 1048 3.038 1.828 2.138 4.628 0.8g Total Investmerts and Advances Other Long-Term Investments Long-Term Note Receivable ntangble Assets 21.01B 17.888 3.938 37M 21 278 20.688 20.116 Net Goodwill 18.038 18.128 18.38 Net Other Intangibles 1888 2.143 2.148 84.528 1298 2498 2488 97.338 Other Assets 1.318 1.313 64.968 Tangble Other Assets Total Assets 49.41B Liabilities &Shareholders' Equity 2016 2017 2018 5-year trend ST Debt&Current Portion LT Debt 114M 500M 208M 201M 7M Short Term Deb 500M Current Portion of Long Tom Debt Aooourts Payable 378M 1.308 4.673 3488 7.028 Provision for Risks& Charges Other Liabilities Other Liabilities (excl. Deferred Income) 2 898 13218 0.188 Non-Equity Reserves Preferred Stock (Carrying Value) Common Equity (Total) 30.18 44 228 50.108 4358 Common Stook ParCarry Value 0.18 9.706 21.678 33.908 41.988 Total Shareholders Equity 36.1B 44.228 50.108 4.358 84 138 36.1B 44 228 50.108 74.358 4.138ul Liabilities & Shareholders' Equity 40.18B 49.41B 64.968 84.528 97.33B Annual Financials for Facebook Inc. CIA wew Rates Fiscal year is January-December. All values USO milion 2014 17 938 0 856 5 456 2 438 3.038 2336 55 848 308 5 048 432B 3.888 12 478 27 848 Cost of Goods Sold (COGS) incl. DBA 2108 3.708 COGS excluding D&A 1248 2348 1.228 310M 751M 10 288 15 088 23 858 35 26 40 488 S-year trend SG&A Expense 8778 758 028 Research & Development 2 048 928 7 756 0 278. Other SG&A 2 056 7 248 Other Operating Expense Unusual Expense EBIT aher Unusual Expense Non Operating Income Expense Non-Operating Interest Income Equity in Affiliaes (Preta 238 178M 01M Interest Expense Gross Interest Expense Interest Capitalized Pretax Incoome 2 528 ncome Tax 4 806 gal. Income Tax Current Domestic Income Tax-Current Foreign Income Tax-Deferred Domestic Income Tax-Deferred Foreign Income Tax Credits 1928 1038 350M 254V) -r. Equity in Afflate Other After Tax Income (Expense) Consolidated Net Income (15M 3.076 15 28 Net Income 2.93B 3.678 15.928 22.11B Extra Items&GainLoss Sale Of Asse CumulativeEffect Accounting Chg 0.196 15 926 Net Income After Extraordinaries Prelerred Dividends Net Income Avalable to Common EPS (Basic) Basic Shares Outstanding 2.038 3 676 15 28 22.116 2 806 EPS (Diluted) 28IIIIl 238 Diluted Shares Outstanding 2008 2 856 2 938 8 24B 4 776 23 236 Annual Financials for Facebook Inc. CIA View Ratios Assets 2016 2017 2018 5-year trend year is January-December. All values USD milions 41.12 0.038 29.458 11 28 4.328 6.888 1.688 1.088 1.728 8.438 4.918 3.538 2.568 2 588 2638 Cash & Short Term Investments 8.088 33.638 5.838 5 838 6 028 (159M) Cash Only 20.558 3.998 3.908 4.096 Short-Term Investments 7.508l 7508 7828 ..! Total Accounts Receivable Accounts Receivables, Net Accounts Receivabies, Gross Bad Debt Doubtful Accounts Finished Goods Raw Materials Progress Payments& Other 1.028 1.778 Other Current Assets 1.028 77B Miscellaneous Current Assets 48.568ll Total Current Assets 13.078 21.658 34.48 2015 2017 2018 5-year trend Not Property. Plant& Equipment 5.806 7.828 2 278 506M 8.586 11.88 3.11B 3.729 18.348 4.91B 798M 24.088 Property, Plant & Equipment-Gross 5.788 31.578 .428 153M Computer Software and Equipment Other Property. Plant & Equipment 1048 3.038 1.828 2.138 4.628 0.8g Total Investmerts and Advances Other Long-Term Investments Long-Term Note Receivable ntangble Assets 21.01B 17.888 3.938 37M 21 278 20.688 20.116 Net Goodwill 18.038 18.128 18.38 Net Other Intangibles 1888 2.143 2.148 84.528 1298 2498 2488 97.338 Other Assets 1.318 1.313 64.968 Tangble Other Assets Total Assets 49.41B Liabilities &Shareholders' Equity 2016 2017 2018 5-year trend ST Debt&Current Portion LT Debt 114M 500M 208M 201M 7M Short Term Deb 500M Current Portion of Long Tom Debt Aooourts Payable 378M 1.308 4.673 3488 7.028 Provision for Risks& Charges Other Liabilities Other Liabilities (excl. Deferred Income) 2 898 13218 0.188 Non-Equity Reserves Preferred Stock (Carrying Value) Common Equity (Total) 30.18 44 228 50.108 4358 Common Stook ParCarry Value 0.18 9.706 21.678 33.908 41.988 Total Shareholders Equity 36.1B 44.228 50.108 4.358 84 138 36.1B 44 228 50.108 74.358 4.138ul Liabilities & Shareholders' Equity 40.18B 49.41B 64.968 84.528 97.33B