

Question
For the Years Ended Dec Dec Dec 2020 2019 2018 Total revenues 4.117.411 3.618.774 3.432.867 Total cost of sales 2.522.918 2.216.275 2.130.188 Operating margin 1.594.493
|
| For the Years Ended | |||||||||
|
| Dec | Dec | Dec | |||||||
|
| 2020 | 2019 | 2018 | |||||||
| Total revenues |
| 4.117.411 | 3.618.774 | 3.432.867 | ||||||
| Total cost of sales |
| 2.522.918 | 2.216.275 | 2.130.188 | ||||||
|
| ||||||||||
| Operating margin |
| 1.594.493 | 1.402.499 | 1.302.679 | ||||||
| General and administrative |
| 406.613 | 382.293 | 372.464 | ||||||
| U.S. franchise advertising |
| 462.238 | 390.799 | 358.526 | ||||||
| Income from operations |
| 725.642 | 629.407 | 571.689 | ||||||
| Interest income |
| 1.654 | 4.048 | 3.334 | ||||||
| Interest expense |
| -172.166 | -150.818 | -146.345 | ||||||
|
| ||||||||||
| Income before provision for income taxes |
| 55.513 | 482.637 | 428.678 | ||||||
| Provision for income taxes |
| 63.834 | 81.928 | 66.706 | ||||||
|
| ||||||||||
| Net income |
| 491.296 | 400.709 | 361.972 | ||||||
You are asked to analyze the company financial statements from different perspectives to assess how the company is positioned vs its main competitor. They provide you with some key indicators.
- 1- Analyze the profitability of the company.
- To do that calculate:
- The gross margin percentage (4 points)
- The return on total assets (4 points)
- The return on equity (4 points)
- They provide you with some key indicators of the company main competitor. How is the XYZ corporation compared to their main competitor in terms of profitability? (4 points)
- Gross Profit margin= 30%
- To do that calculate:
ROE= 13%
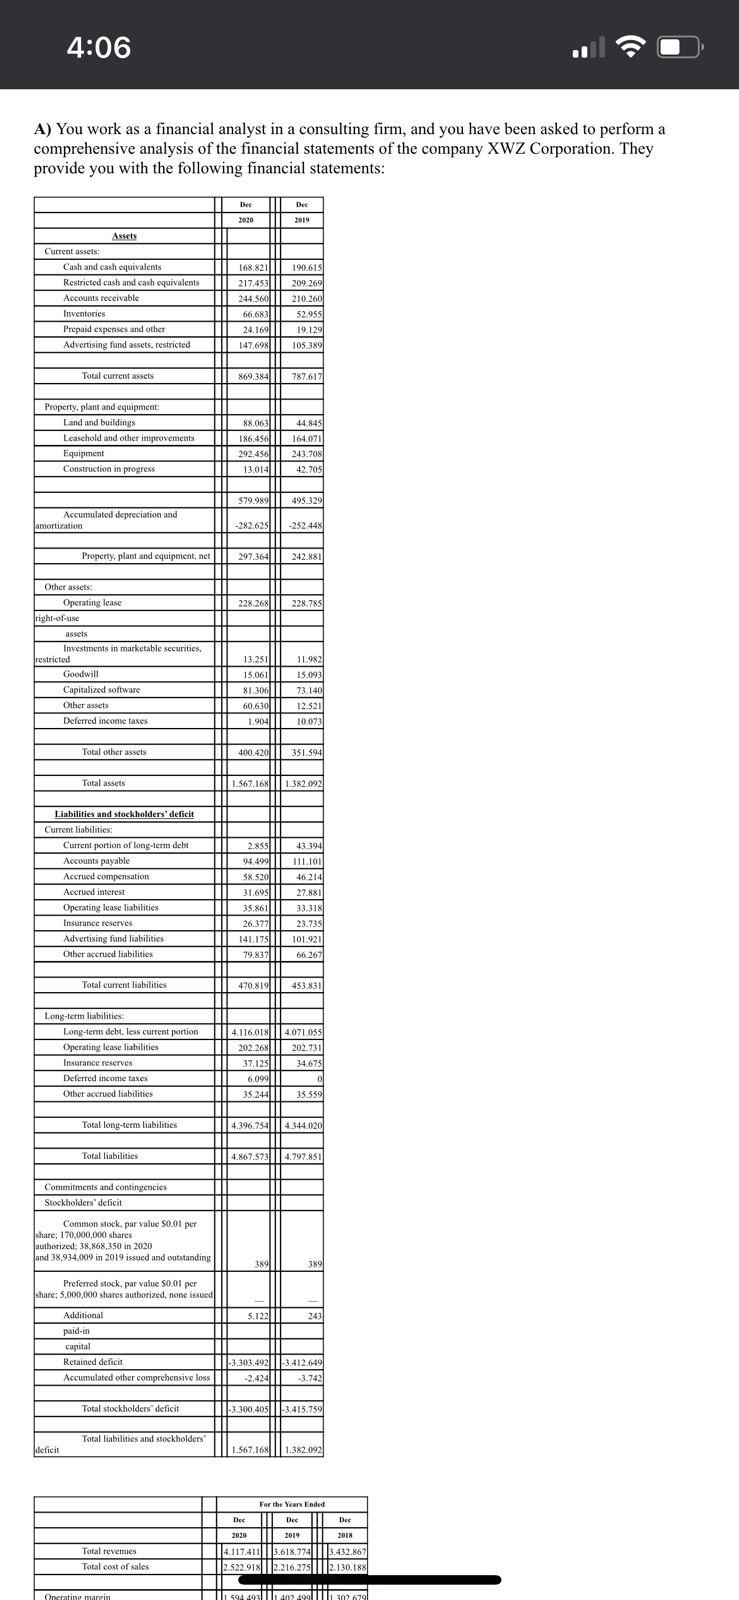
4:06 A) You work as a financial analyst in a consulting firm, and you have been asked to perform a comprehensive analysis of the financial statements of the company XWZ Corporation. They provide you with the following financial statements: Dec Des 2020 2019 190.6181 168.821 217,453 Assets Current assets: Cash and cash equivalents Restricted cash and cash equivalents Accounts receivable Inventories Prepaid expenses and other Advertising fund assets, restricted 244,500 66,683 24.169 147,698 209.269 210.2601 52.955 19.1291 105.3891 Total current assets 869,384 || 787.617 Property, plant and equipment: Land and buildings Leasehold and other improvements Equipment Construction in progress 88.063 | 44.845 186.456 || 164.071 292.456 || 243.708 13.014 42.705 379.989 || 495.329 Accumulated depreciation and amortization -282.625 -252.448 Property, plant and equipment, net 297.3641 242.881 228.2681 11 228.785 Other assets: Operating lease right-of-use assets Investments in marketable securities, restricted Goodwill Capitalized software Other assets Deferred income taxes 13.251||||11.982 15.061 15.093 81.306111 73.140 60.630 || 12.5211 1.904111 10.0731 Total other assets 400.4201 11 351 394 Total assets 1.567.168||| 1.382.092 UN III mi II Liabilities and stockholders' deficit Current liabilities: Current portion of long-term debt Accounts payable Accrued compensation Accrued interest Operating lease liabilities Insurance reserves Advertising fund liabilities Other accrued liabilities 2.8511 43.394 94.499 || 111.101 $8.520 | 46.2141 31.695 27.8811 35.861 33.3181 26.377 23.7351 141.175 101.921 79.83711 66.267 Total current liabilities 470.819|||| 453.831 Long-term liabilities: Long-term debt, less current portion Operating lease liabilities Insurance reserves Deferred income taxes Other accrued liabilities 4.116.018||| 4.071.055 202.268 || 202.731 37.125 34.675 0 35.244 35 339 6.090/7 Total long-term liabilities 4.396.754 | 4.344.020 Total liabilities 4.867.57 4.797851 Commitments and contingencies Stockholders' deficit Common stock, par value $0.01 per share: 170,000,000 shares authorized: 38,868,350 in 2020 and 38,934.009 in 2019 issued and outstanding 38911 3891 Preferred stock, par value 0.01 per share: 5,000,000 shares authorized, none issued 5.122 | 2431 Additional paid in capital Retained deficit Accumulated other comprehensive loss -3.303.492 ||-3.412.649 -2.424 -3.7421 Total stockholders' deficit -3.300,405 1-3.415.759 Total liabilities and stockholders deficit 1.567.168 1.382.092 For the Years Eoded Dec Dec Dec 2020 2019 2018 Total revenues Total cost of sales 4.117.411 2.522.918 3.618.774 3.432.867 2.216.275|||||2.130.188 Orxerating margin 1 594 492/ 402 400 302.679Step by Step Solution
There are 3 Steps involved in it
Step: 1

Get Instant Access to Expert-Tailored Solutions
See step-by-step solutions with expert insights and AI powered tools for academic success
Step: 2

Step: 3
Ace Your Homework with AI
Get the answers you need in no time with our AI-driven, step-by-step assistance
Get Started
Financial Accounting an introduction to concepts, methods and uses
Authors: Clyde P. Stickney, Roman L. Weil, Katherine Schipper, Jennifer Francis
13th Edition
978-0538776080, 324651147, 538776080, 9780324651140, 978-0324789003