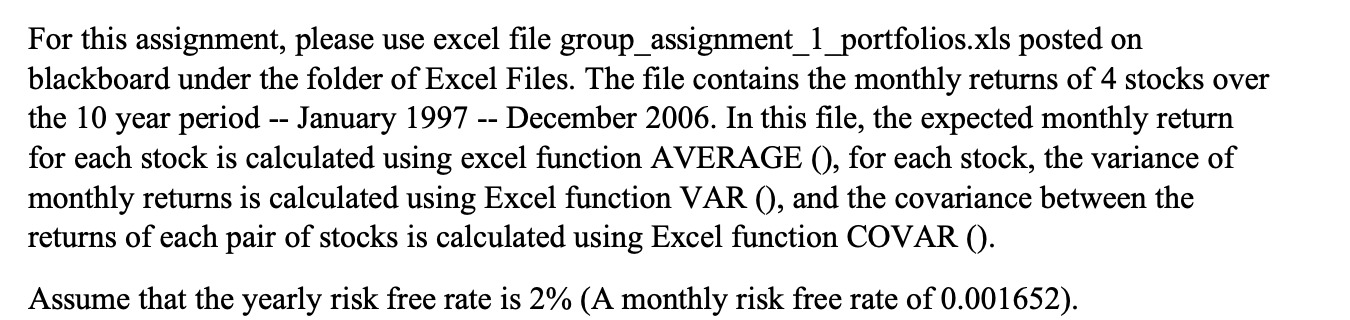

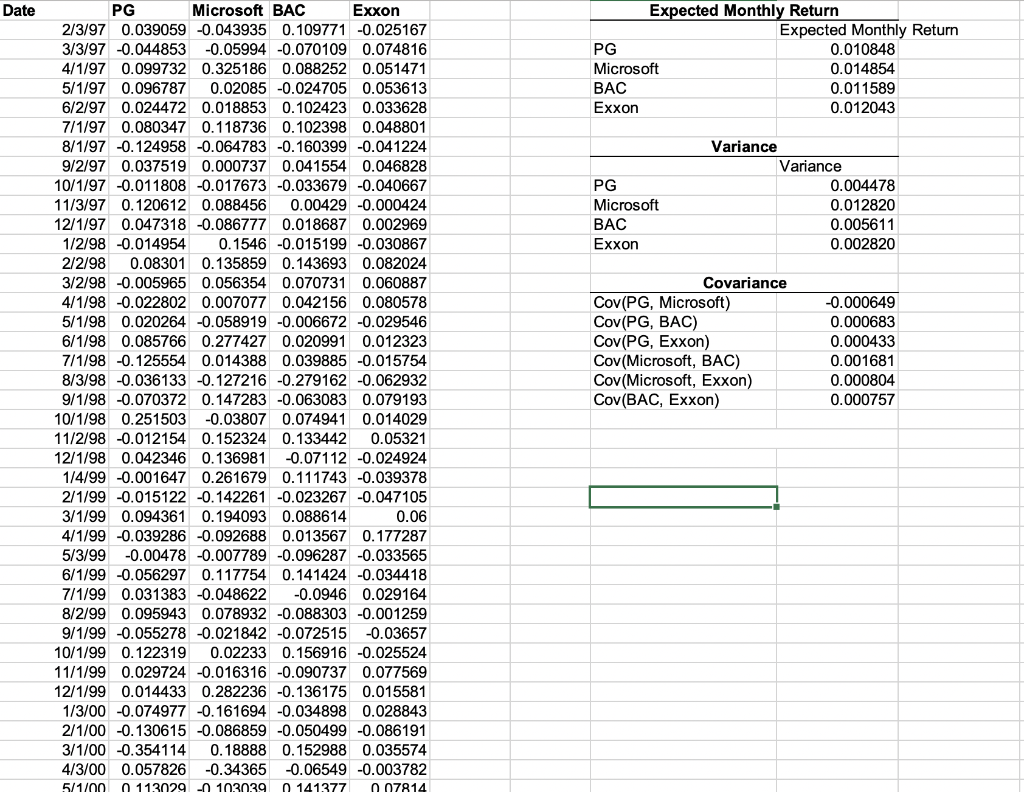
For this assignment, please use excel file group_assignment_1_portfolios.xls posted on blackboard under the folder of Excel Files. The file contains the monthly returns of 4 stocks over the 10 year period -- January 1997 -- December 2006. In this file, the expected monthly return for each stock is calculated using excel function AVERAGE (), for each stock, the variance of monthly returns is calculated using Excel function VAR (), and the covariance between the returns of each pair of stocks is calculated using Excel function COVAR (). Assume that the yearly risk free rate is 2% (A monthly risk free rate of 0.001652). (c) Find the global minimum variance portfolio. What is the expected return and variance of return of this portfolio? Date PG Expected Monthly Return Expected Monthly Return PG 0.010848 Microsoft 0.014854 BAC 0.011589 Exxon 0.012043 PG Microsoft BAC Exxon Variance Variance 0.004478 0.012820 0.005611 0.002820 Microsoft BAC Exxon 2/3/97 0.039059 -0.043935 0.109771 -0.025167 3/3/97 -0.044853 -0.05994 -0.070109 0.074816 4/1/97 0.099732 0.325186 0.088252 0.051471 5/1/97 0.096787 0.02085 -0.024705 0.053613 6/2/97 0.024472 0.018853 0.102423 0.033628 7/1/97 0.080347 0.118736 0.102398 0.048801 8/1/97 -0.124958 -0.064783 -0.160399 -0.041224 9/2/97 0.037519 0.000737 0.041554 0.046828 10/1/97 -0.011808 -0.017673 -0.033679 -0.040667 11/3/97 0.120612 0.088456 0.00429 -0.000424 12/1/97 0.047318 -0.086777 0.018687 0.002969 1/2/98 -0.014954 0.1546 -0.015199 -0.030867 2/2/98 0.08301 0.135859 0.143693 0.082024 3/2/98 -0.005965 0.056354 0.070731 0.060887 4/1/98 -0.022802 0.007077 0.042156 0.080578 5/1/98 0.020264 -0.058919 -0.006672 -0.029546 6/1/98 0.085766 0.277427 0.020991 0.012323 7/1/98 -0.125554 0.014388 0.039885 -0.015754 8/3/98 -0.036133 -0.127216 -0.279162 -0.062932 9/1/98 -0.070372 0.147283 -0.063083 0.079193 10/1/98 0.251503 -0.03807 0.074941 0.014029 11/2/98 -0.012154 0.152324 0.133442 0.05321 12/1/98 0.042346 0.136981 -0.07112 -0.024924 1/4/99 -0.001647 0.261679 0.111743 -0.039378 2/1/99 -0.015122 -0.142261 -0.023267 -0.047105 3/1/99 0.094361 0.194093 0.088614 0.06 4/1/99 -0.039286 -0.092688 0.013567 0.177287 5/3/99 -0.00478 -0.007789 -0.096287 -0.033565 6/1/99 -0.056297 0.117754 0.141424 -0.034418 7/1/99 0.031383 -0.048622 -0.0946 0.029164 8/2/99 0.095943 0.078932 -0.088303 -0.001259 9/1/99 -0.055278 -0.021842 -0.072515 -0.03657 10/1/99 0.122319 0.02233 0.156916 -0.025524 11/1/99 0.029724 -0.016316 -0.090737 0.077569 12/1/99 0.014433 0.282236 -0.136175 0.015581 1/3/00 -0.074977 -0.161694 -0.034898 0.028843 2/1/00 -0.130615 -0.086859 -0.050499 -0.086191 3/1/00 -0.354114 0.18888 0.152988 0.035574 4/3/00 0.057826 -0.34365 -0.06549 -0.003782 5/1/00 113029 - 1030391 41377 07814 Covariance Cov(PG, Microsoft) Cov(PG, BAC) Cov(PG, Exxon) Cov(Microsoft, BAC) Cov(Microsoft, Exxon) Cov(BAC, Exxon) -0.000649 0.000683 0.000433 0.001681 0.000804 0.000757