

Answered step by step
Verified Expert Solution
Question
1 Approved Answer
For this assignment - you will demonstrate your ability to use Excel Pivot tables to analyze data and produce charts/graphs to aid you in presenting
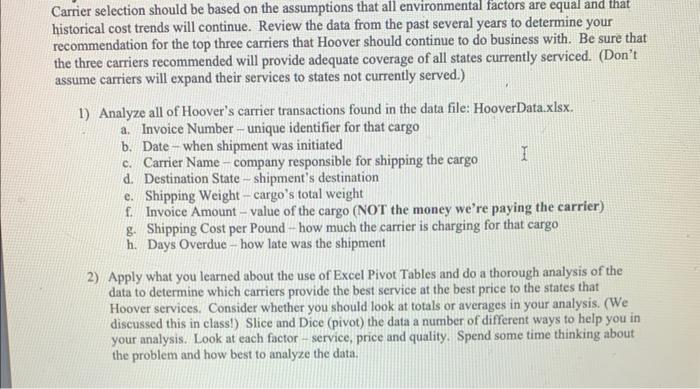
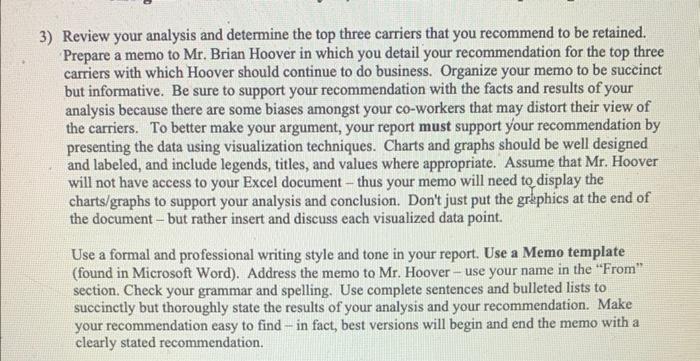
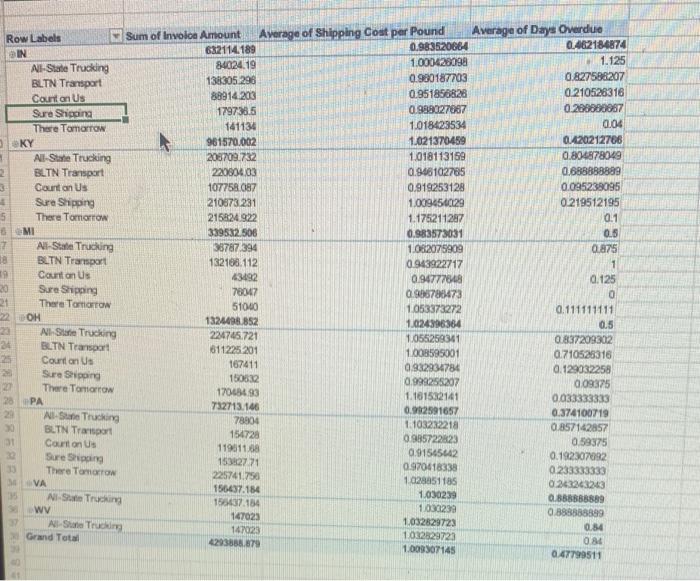 For this assignment - you will demonstrate your ability to use Excel Pivot tables to analyze data and produce charts/graphs to aid you in presenting your analysis and supporting your recommendations. Case Background: Hoover Medical Supplies, Inc, is a large manufacturing company located in Columbus, Ohio. The company is currently seeking to gain operational efficiencies in its supply chain by reducing the number of transportation carriers that it is using from five to three and thereafter open discussions concerning volume discounts with its remaining carriers. Brian Hoover, the CEO of Hoover Medical Supplies, has hired you to analyze its data and make a clear recommendation about how to reduce transportation costs while retaining a high level of service from its best carriers. Hoover has customers in Michigan, West Virginia, Virginia, Pennsylvania, Indiana, Kentucky and Ohio. Data Available: The HooverData.xlsx file contains all the shipping invoices submitted by its current carriers and paid by Hoover. Shipping is billed by the pound at a rate that considers fuel costs, driver costs and truck costs. The file also includes data collected by tracking the delivery schedule of the shipments - reflected in the column of Days Overdue. Late deliveries are not tolerated by Hoover's customers and need to be Carrier selection should be based on the assumptions that all environmental factors are equal and that historical cost trends will continue. Review the data from the past several years to determine your recommendation for the top three carriers that Hoover should continue to do business with. Be sure that the three carriers recommended will provide adequate coverage of all states currently serviced. (Don't assume carriers will expand their services to states not currently served.) 1) Analyze all of Hoover's carrier transactions found in the data file: HooverData.xlsx. a. Invoice Number - unique identifier for that cargo b. Date - when shipment was initiated c. Carrier Name - company responsible for shipping the cargo d. Destination State - shipment's destination e. Shipping Weight - cargo's total weight f. Invoice Amount - value of the cargo (NOT the money we're paying the carrier) g. Shipping Cost per Pound - how much the carrier is charging for that cargo h. Days Overdue - how late was the shipment 2) Apply what you learned about the use of Excel Pivot Tables and do a thorough analysis of the data to determine which carriers provide the best service at the best price to the states that Hoover services. Consider whether you should look at totals or averages in your analysis. (We discussed this in class!) Slice and Dice (pivot) the data a number of different ways to help you in your analysis. Look at each factor - service, price and quality. Spend some time thinking about the problem and how best to analyze the data. 3) Review your analysis and determine the top three carriers that you recommend to be retained. Prepare a memo to Mr. Brian Hoover in which you detail your recommendation for the top three carriers with which Hoover should continue to do business. Organize your memo to be succinct but informative. Be sure to support your recommendation with the facts and results of your analysis because there are some biases amongst your co-workers that may distort their view of the carriers. To better make your argument, your report must support your recommendation by presenting the data using visualization techniques. Charts and graphs should be well designed and labeled, and include legends, titles, and values where appropriate. Assume that Mr. Hoover will not have access to your Excel document - thus your memo will need to display the charts/graphs to support your analysis and conclusion. Don't just put the graphics at the end of the document - but rather insert and discuss each visualized data point. Use a formal and professional writing style and tone in your report. Use a Memo template (found in Microsoft Word). Address the memo to Mr. Hoover - use your name in the "From" section. Check your grammar and spelling. Use complete sentences and bulleted lists to succinctly but thoroughly state the results of your analysis and your recommendation. Make your recommendation easy to find - in fact, best versions will begin and end the memo with a clearly stated recommendation. Row Labels Sum of lnvolce Amount Average of Shipping Cost per Pound Average of Days Overdue
Step by Step Solution
There are 3 Steps involved in it
Step: 1

Get Instant Access to Expert-Tailored Solutions
See step-by-step solutions with expert insights and AI powered tools for academic success
Step: 2

Step: 3
Ace Your Homework with AI
Get the answers you need in no time with our AI-driven, step-by-step assistance
Get Started
Database And Expert Systems Applications 33rd International Conference Dexa 2022 Vienna Austria August 22 24 2022 Proceedings Part 1 Lncs 13426
Authors: Christine Strauss ,Alfredo Cuzzocrea ,Gabriele Kotsis ,A Min Tjoa ,Ismail Khalil
1st Edition
3031124227, 978-3031124228