

Question
For Tuscan Lifestyles the average cost per prospect name is $0.10. These prospects are sent a catalog. The cost of sending a typical catalog is
For Tuscan Lifestyles the average cost per prospect name is $0.10. These prospects are sent a catalog. The cost of sending a typical catalog is about $0.95 including printing and postage. Adding in the 10 cents per prospect name brings the cost to send a catalog to a prospect to $1.05. The industry average for response rates from prospect lists ranges from less than 1.0% to approximately 2.0% depending on the source of the list. 1 Tuscan Lifestyles has realized an above-average response rate averaging 2.3% meaning that, on average, every 1000 catalogs sent to prospects will yield 23 new customers who place an order. Once a prospect places an order, they are entered into Tuscan Lifestyles customer database. Tuscan Lifestyles mails 5 catalogs one per season plus one holiday catalog annually to all customers on its list. The cost of a mailing a catalog to a customer is approximately $0.95. Since it is hard to know when or if a customer will place another order, Tuscan Lifestyles has continued to mail catalogs to all its customers. That is, Tuscan Lifestyles has yet to drop any names from the customer list. Since the average initial purchase was $58, the analyst rounded down to $50 and used that to divide the 7953 new customers into two groups: those whose initial purchase was less than $50, and those whose initial purchase was $50 or more. Of the total, there were 4567 that made an initial purchase less than $50 and 3386 with an initial purchase of at least $50.
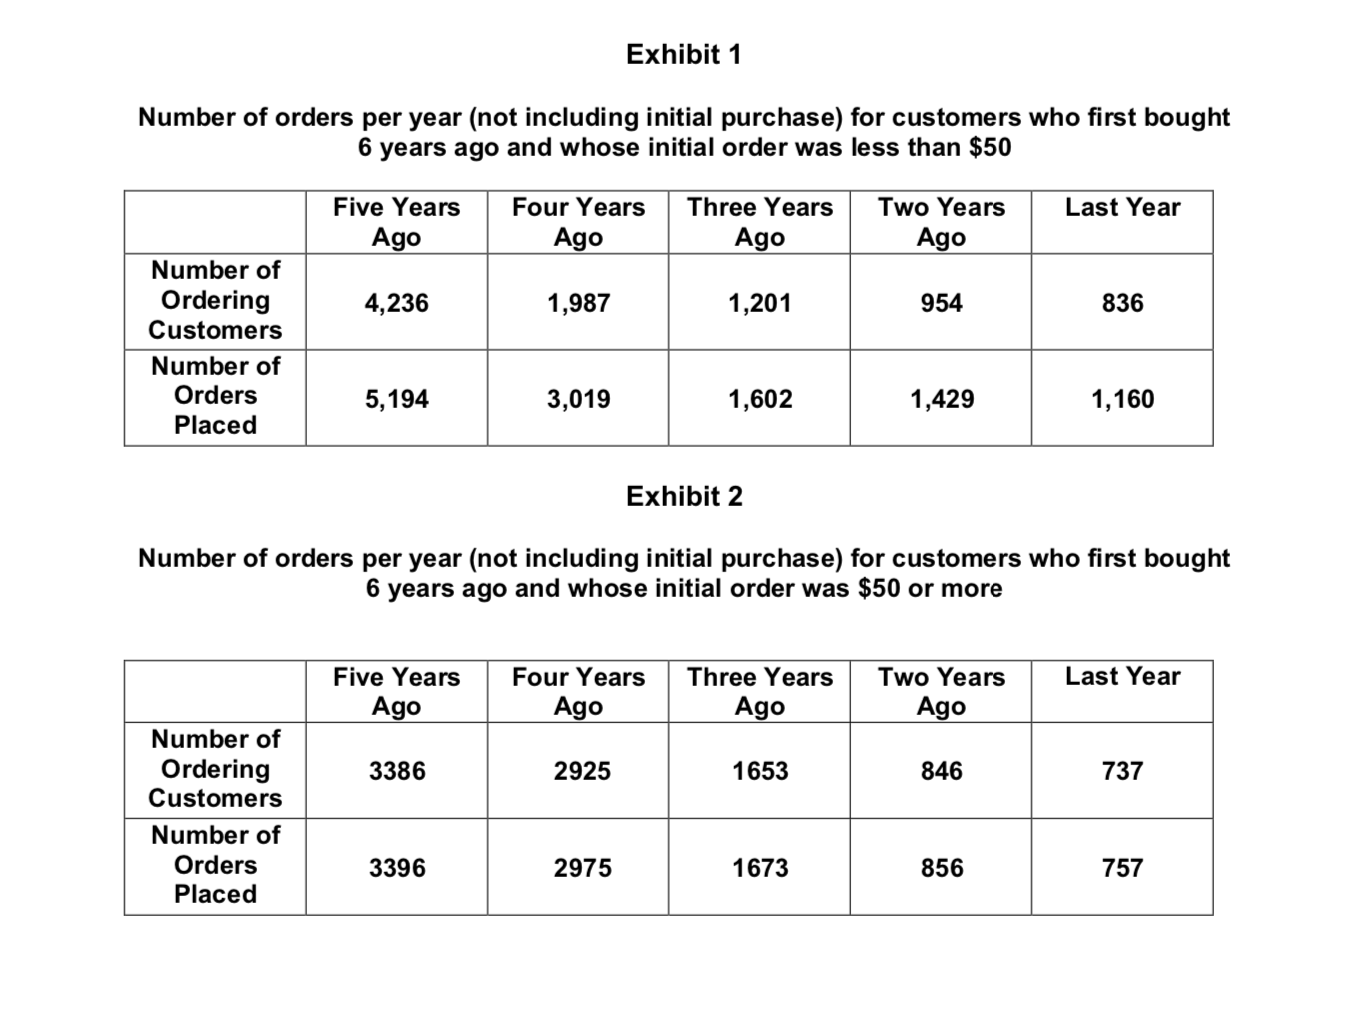
Next, for each group he tracked the number of repeat purchases in each of their first 5 years as a customer of Tuscan Lifestyles. In any given year, there were some who did not make a repeat purchase and some who made one or more repeat purchases. Exhibits 1 and 2 summarize these results. In any given frequency table, the first row represents the total number of purchases made, the second row represents the number of customers who made the corresponding number of purchases. In interpreting these exhibits, note that # orders 5 years ago reflects orders placed during customers first year as a customer, # orders 4 years ago reflect orders placed during customers second year as a customer, and that # orders last year reflect orders placed during customers fifth year as a customer.
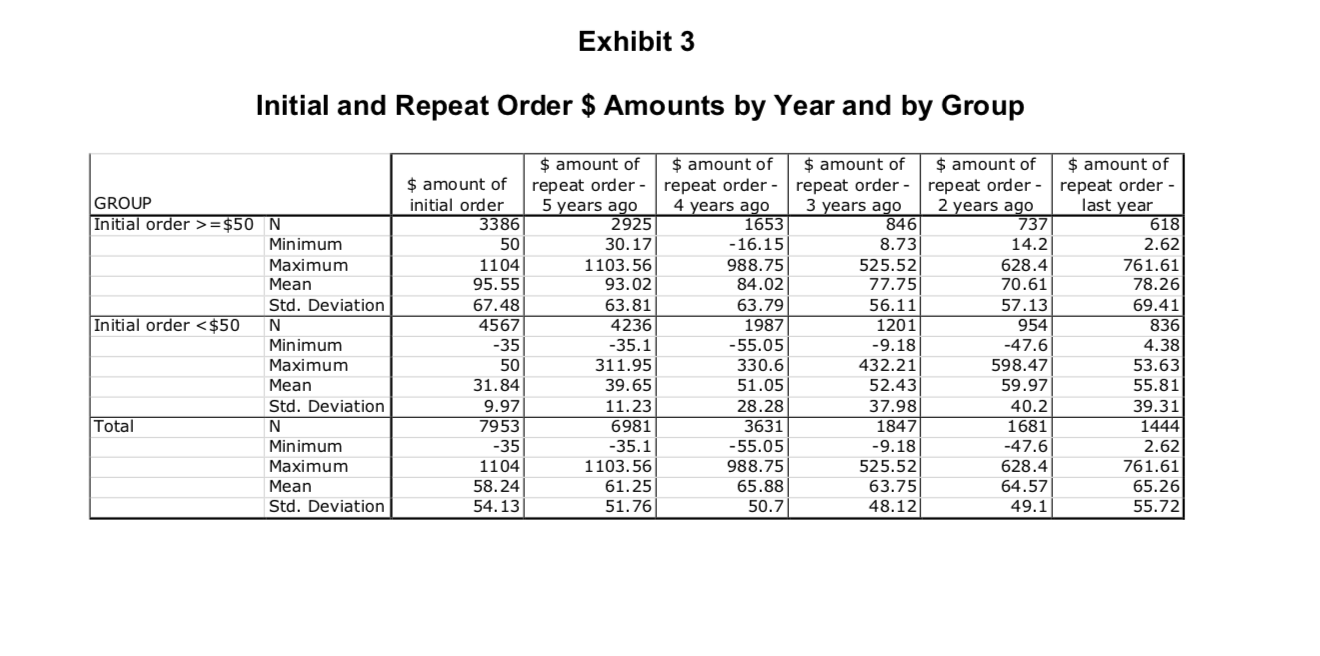
Finally, for each of the two groups the analyst computed the average initial order size (in dollars) and the average repeat order size for years 1 through 5. This information is summarized in Exhibit 3. (Hint: All exhibits were produced in SPSS, hence the formats are comparable to others weve seen in this class.)
Armed with this information, Joan wants to know the average lifetime value of a customer for each group. That is, what is the average lifetime value of a customer whose initial purchase is less than $50? And what is the average lifetime value of a customer whose initial purchase is $50 or greater? In making these calculations, Joan has instructed you to assume the COGS is about 58% of the revenue and to use a discount factor of 5% (2.5% interest x a risk factor of 2).
Joan has turned this information over to you and scheduled a meeting to review your analysis and conclusions. In preparation for this meeting you should determine the average lifetime value of a customer for each of the two groups. In addition, Joan mentioned several other points that she would like your thoughts on:
What is the LTV over five years for customers who initially spend less than $50?
What is the LTV over five years for customers who initially spend $50 or more?
Based on your findings, which group of customers has higher LTV?
Since when has the lower LTV group of customers become profitable?
Should you keep sending catalogs to the lower LTV group of customers? Why or why not?
Step by Step Solution
There are 3 Steps involved in it
Step: 1

Get Instant Access to Expert-Tailored Solutions
See step-by-step solutions with expert insights and AI powered tools for academic success
Step: 2

Step: 3
Ace Your Homework with AI
Get the answers you need in no time with our AI-driven, step-by-step assistance
Get Started
Frauds Of The Past Lessons For The Future A Student Led Journey Through The World Of Auditing
Authors: Dr. Manjari Sharma, Mr. Pragadeesh SP, Mr. Sivanaresh A
1st Edition
B0CGKRP289, 978-6206753247