For ungrouped use 8 classes

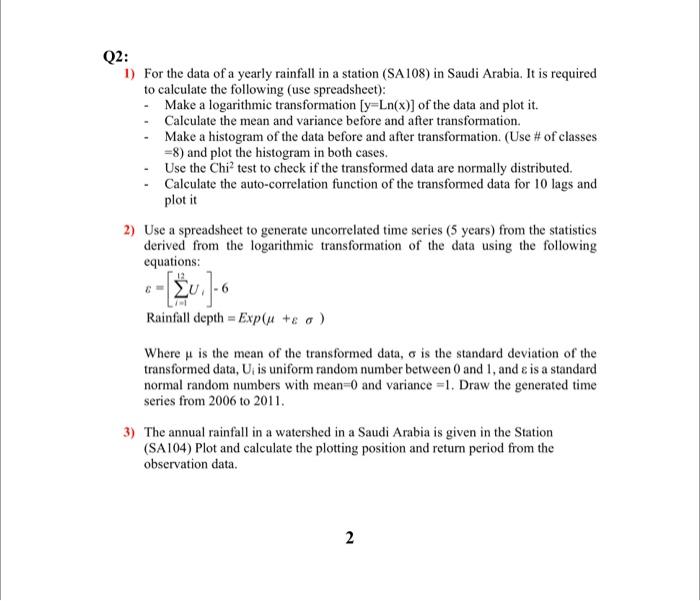
Q2: 1) For the data of a yearly rainfall in a station (SA108) in Saudi Arabia. It is required to calculate the following (use spreadsheet): - Make a logarithmic transformation [y=Ln(x)] of the data and plot it. - Calculate the mean and variance before and after transformation. - Make a histogram of the data before and after transformation. (Use \# of classes =8 ) and plot the histogram in both cases. - Use the Chi2 test to check if the transformed data are normally distributed. - Calculate the auto-correlation function of the transformed data for 10 lags and plot it 2) Use a spreadsheet to generate uncorrelated time series ( 5 years) from the statistics derived from the logarithmic transformation of the data using the following equations: =[i=112Ui]6Rainfalldepth=Exp(+) Where is the mean of the transformed data, is the standard deviation of the transformed data, Ui is uniform random number between 0 and 1 , and is a standard normal random numbers with mean =0 and variance =1. Draw the generated time series from 2006 to 2011. 3) The annual rainfall in a watershed in a Saudi Arabia is given in the Station (SA104) Plot and calculate the plotting position and retur period from the observation data. Q2: 1) For the data of a yearly rainfall in a station (SA108) in Saudi Arabia. It is required to calculate the following (use spreadsheet): - Make a logarithmic transformation [y=Ln(x)] of the data and plot it. - Calculate the mean and variance before and after transformation. - Make a histogram of the data before and after transformation. (Use \# of classes =8 ) and plot the histogram in both cases. - Use the Chi2 test to check if the transformed data are normally distributed. - Calculate the auto-correlation function of the transformed data for 10 lags and plot it 2) Use a spreadsheet to generate uncorrelated time series ( 5 years) from the statistics derived from the logarithmic transformation of the data using the following equations: =[i=112Ui]6Rainfalldepth=Exp(+) Where is the mean of the transformed data, is the standard deviation of the transformed data, Ui is uniform random number between 0 and 1 , and is a standard normal random numbers with mean =0 and variance =1. Draw the generated time series from 2006 to 2011. 3) The annual rainfall in a watershed in a Saudi Arabia is given in the Station (SA104) Plot and calculate the plotting position and retur period from the observation data


