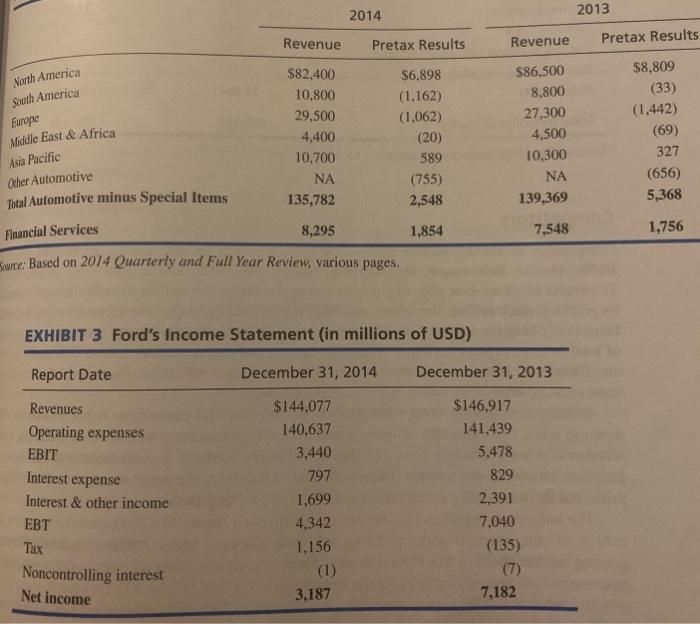
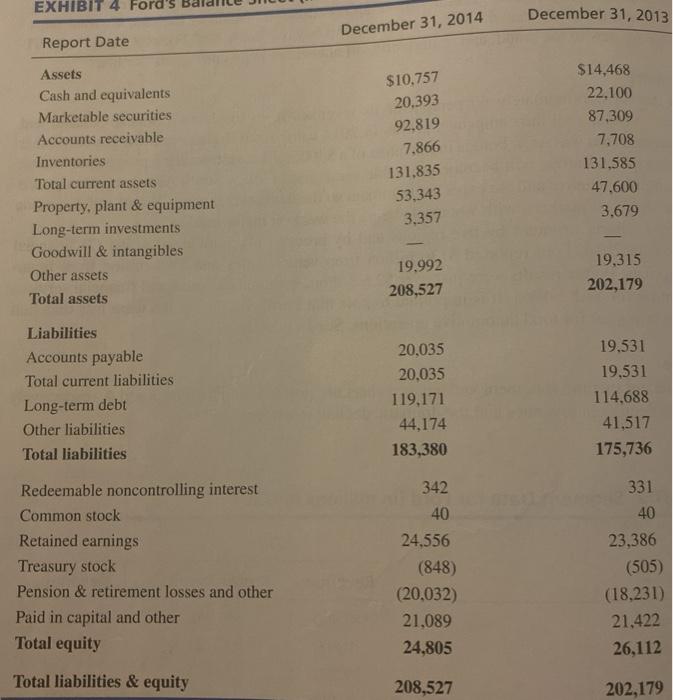
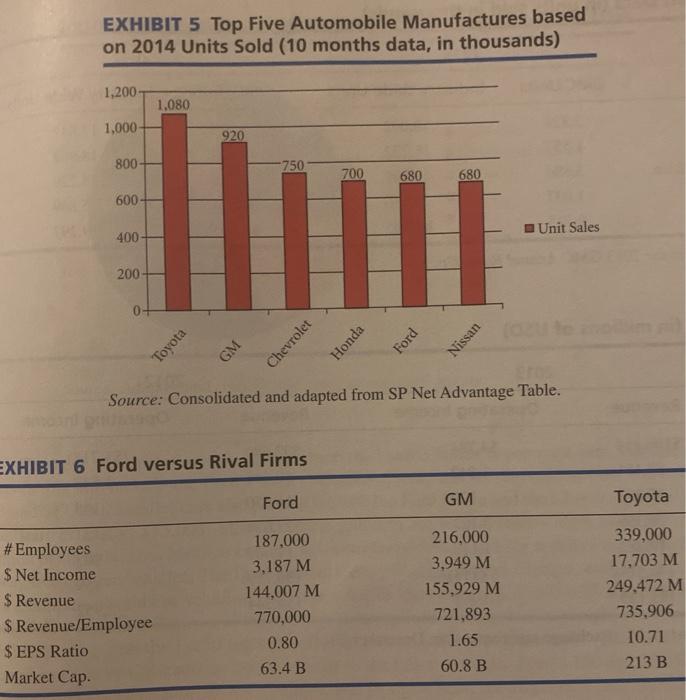
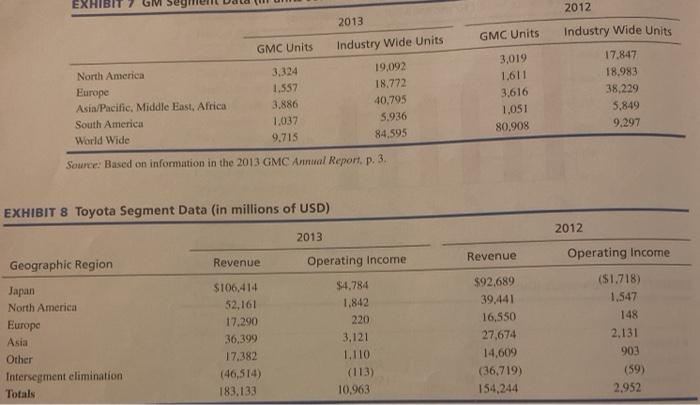
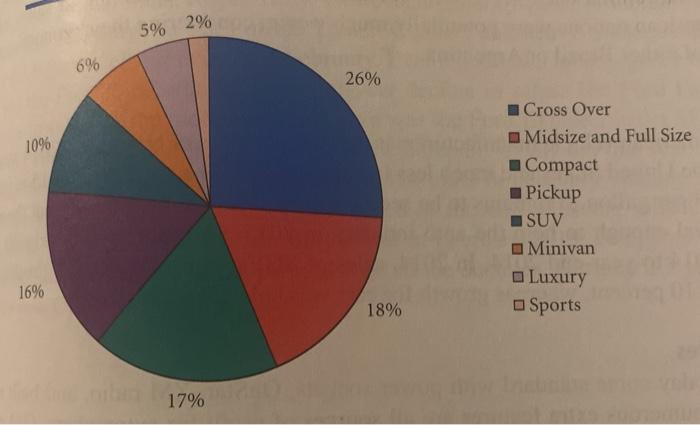
For your chosen case study from Module 1, use their income statements and balance sheets provided at the end of the text to prepare the financial ratios identified in items 1-5 below. To assist you in your calculations, use Table 4-4 on page 106: Summary of Key Financial Ratios. At the end of each section, please provide an analysis on what the ratios are telling you about the financial health of your chosen business. Remember to be specific in your analysis and use your critical thinking skills. (1) Liquidity ratios Current Ratio Quick ratio (2) Leverage ratios Debt-to-total-assets ratio Debt-to-equity ratio Long-term debt-to-equity ratio Times-interest-earned ratio (3) Activity ratio Inventory turnover fixed assets turnover Total assets turnover Accounts receivable turnover Average collection period (4) Profitability ratios Returns generated on sales and investment Gross profit margin Operating profit margin Net profit margin Return on total assets (ROA) Return on stockholders equity (ROE) Earnings per Share (EPS) (4) Profitability ratios Returns generated on sales and investment Gross profit margin Operating profit margin Net profit margin Return on total assets (ROA) Return on stockholders' equity (ROE) Earnings per Share (EPS) Price earnings ratio (5) Growth ratios Net income Earnings per share Dividends per share 2014 2013 Revenue Pretax Results Revenue Pretax Results North America South America Europe Middle East & Africa $82,400 10,800 29,500 4,400 10.700 NA 135,782 $6.898 (1,162) (1,062) (20) 589 (755) 2,548 $86,500 8,800 27,300 4.500 10,300 NA 139,369 $8,809 (33) (1,442) (69) 327 (656) 5,368 Asia Pacific Other Automotive Total Automotive minus Special Items Financial Services 8,295 1,854 7,548 1,756 wce: Based on 2014 Quarterly and Full Year Review, various pages. EXHIBIT 3 Ford's Income Statement (in millions of USD) Report Date December 31, 2014 December 31, 2013 Revenues Operating expenses EBIT Interest expense $144,077 140.637 3,440 797 1,699 4,342 1,156 $146,917 141,439 5,478 829 2,391 7,040 (135) Interest & other income Tax Noncontrolling interest Net income 3,187 7,182 EXHIBIT 4 Ford's December 31, 2013 December 31, 2014 Report Date Assets Cash and equivalents Marketable securities Accounts receivable Inventories Total current assets Property, plant & equipment Long-term investments Goodwill & intangibles Other assets Total assets $10,757 20,393 92.819 7.866 131,835 53,343 3,357 $14,468 22.100 87.309 7,708 131,585 47.600 3.679 19.992 208,527 19,315 202,179 Liabilities Accounts payable Total current liabilities Long-term debt Other liabilities Total liabilities 20,035 20.035 119.171 44,174 183,380 19.531 19,531 114.688 41,517 175,736 Redeemable noncontrolling interest Common stock Retained earnings Treasury stock Pension & retirement losses and other Paid in capital and other Total equity 342 40 24,556 (848) (20,032) 21,089 24,805 331 40 23,386 (505) (18,231) 21,422 26,112 Total liabilities & equity 208,527 202,179 EXHIBIT 5 Top Five Automobile Manufactures based on 2014 Units Sold (10 months data, in thousands) 1,200 1,080 1,000 920 800 -750 700 680 680 600 400 Unit Sales 200 0+ GM Chevrolet Honda Ford Nissan Toyota Source: Consolidated and adapted from SP Net Advantage Table. EXHIBIT 6 Ford versus Rival Firms Ford GM Toyota # Employees $ Net Income $ Revenue $ Revenue/Employee $ EPS Ratio Market Cap. 187.000 3,187 M 144,007 M 770,000 0.80 63.4 B 216,000 3,949 M 155,929 M 721,893 1.65 60.8 B 339,000 17,703 M 249.472 M 735,906 10.71 213 B EXHIBIT 2012 2013 GMC Units Industry Wide Units GMC Units Industry Wide Units North America 3,324 19,092 Europe 1.557 18.772 Asia/Pacific, Middle East, Africa 3.886 40.795 South America 1,037 5.936 World Wide 9.715 84,595 Source: Based on information in the 2013 GMC Annual Report, p. 3. 3,019 1.611 3,616 1.051 80.908 17.847 18.983 38,229 5,849 9.297 EXHIBIT 8 Toyota Segment Data (in millions of USD) 2013 2012 Operating Income Revenue Geographic Region Revenue Japan North America Europe Asia Other Intersegment elimination Totals $106,414 52,161 17.290 36.399 17.382 (46,514) 183.133 Operating Income $4.784 1.842 220 3,121 1.110 (113) 10,963 $92.689 39.441 16.550 27,674 14,609 (36,719) 154,244 ($1.718) 1.547 148 2.131 903 (59) 2,952 5% 2% 6% 26% 10% Cross Over Midsize and Full Size Compact Pickup SUV Minivan Luxury Sports 16% 18% 17%