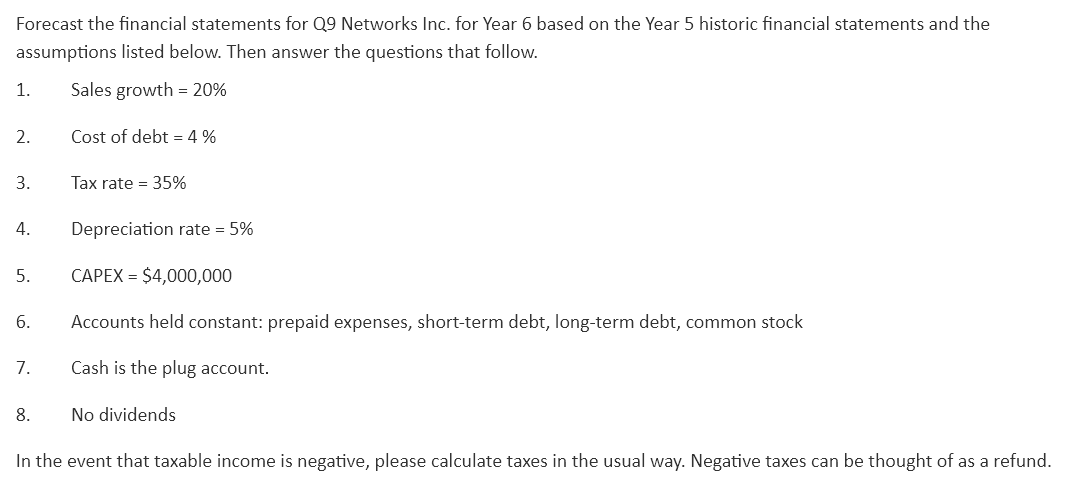
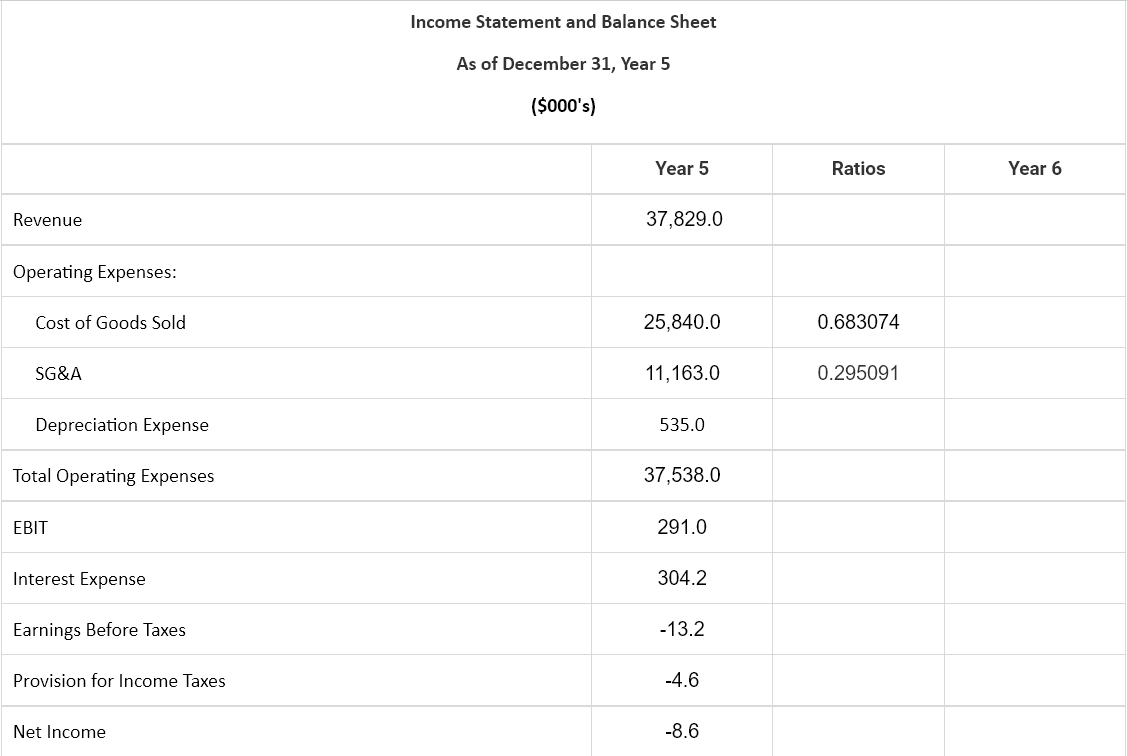

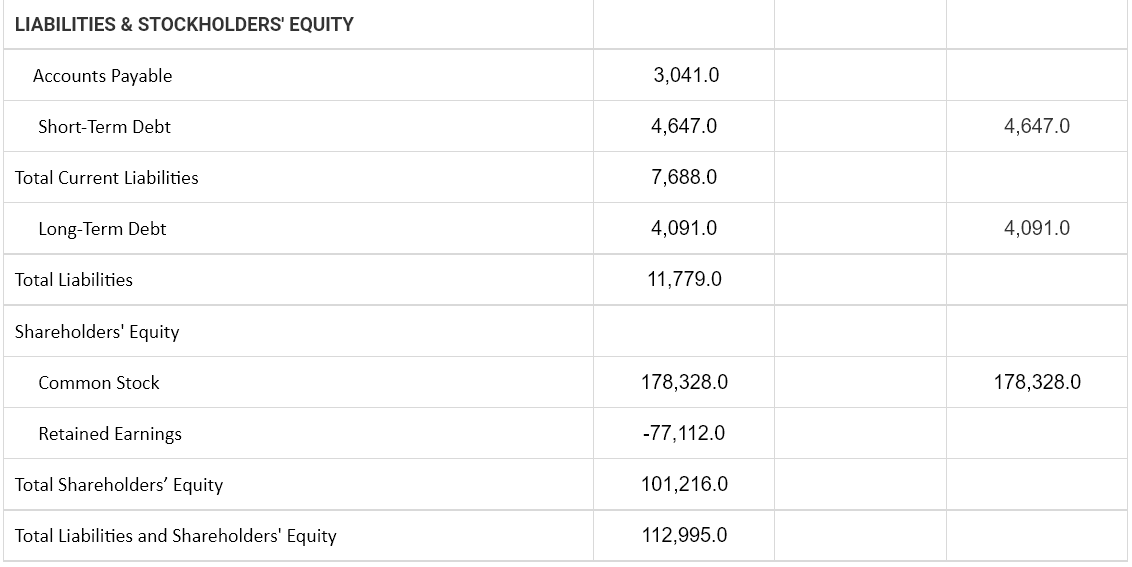
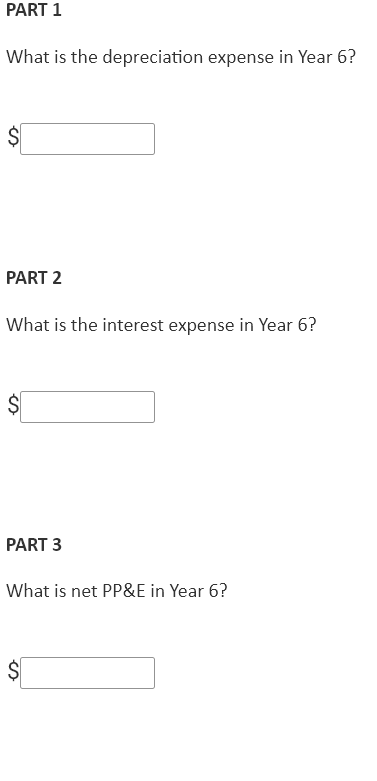
Forecast the financial statements for Q9 Networks Inc. for Year 6 based on the Year 5 historic financial statements and the assumptions listed below. Then answer the questions that follow. Sales growth = 20% 1. 2. 3. 4. 5. 6. 7. 8. Cost of debt = 4% Tax rate = 35% Depreciation rate = 5% CAPEX = $4,000,000 Accounts held constant: prepaid expenses, short-term debt, long-term debt, common stock Cash is the plug account. No dividends In the event that taxable income is negative, please calculate taxes in the usual way. Negative taxes can be thought of as a refund. Revenue Operating Expenses: Cost of Goods Sold SG&A Depreciation Expense Total Operating Expenses EBIT Interest Expense Earnings Before Taxes Provision for Income Taxes Net Income Income Statement and Balance Sheet As of December 31, Year 5 ($000's) Year 5 37,829.0 25,840.0 11,163.0 535.0 37,538.0 291.0 304.2 -13.2 -4.6 -8.6 Ratios 0.683074 0.295091 Year 6 ASSETS Cash Accounts Receivable Prepaid Expenses Total Current Assets Property, Plant, & Equipment, Net Total Assets Year 5 71,192.0 3,242.0 1,804.0 76,238.0 36,757.0 112,995.0 Ratios 0.085701 Year 6 1,804.0 LIABILITIES & STOCKHOLDERS' EQUITY Accounts Payable Short-Term Debt Total Current Liabilities Long-Term Debt Total Liabilities Shareholders' Equity Common Stock Retained Earnings Total Shareholders' Equity Total Liabilities and Shareholders' Equity 3,041.0 4,647.0 7,688.0 4,091.0 11,779.0 178,328.0 -77,112.0 101,216.0 112,995.0 4,647.0 4,091.0 178,328.0 PART 1 What is the depreciation expense in Year 6? PART 2 What is the interest expense in Year 6? $ PART 3 What is net PP&E in Year 6? $ PART 4 What are retained earnings for Year 6? PART 5 What is the total for the plug variable in Year 6? Check Answer Check Answer Forecast the financial statements for Q9 Networks Inc. for Year 6 based on the Year 5 historic financial statements and the assumptions listed below. Then answer the questions that follow. Sales growth = 20% 1. 2. 3. 4. 5. 6. 7. 8. Cost of debt = 4% Tax rate = 35% Depreciation rate = 5% CAPEX = $4,000,000 Accounts held constant: prepaid expenses, short-term debt, long-term debt, common stock Cash is the plug account. No dividends In the event that taxable income is negative, please calculate taxes in the usual way. Negative taxes can be thought of as a refund. Revenue Operating Expenses: Cost of Goods Sold SG&A Depreciation Expense Total Operating Expenses EBIT Interest Expense Earnings Before Taxes Provision for Income Taxes Net Income Income Statement and Balance Sheet As of December 31, Year 5 ($000's) Year 5 37,829.0 25,840.0 11,163.0 535.0 37,538.0 291.0 304.2 -13.2 -4.6 -8.6 Ratios 0.683074 0.295091 Year 6 ASSETS Cash Accounts Receivable Prepaid Expenses Total Current Assets Property, Plant, & Equipment, Net Total Assets Year 5 71,192.0 3,242.0 1,804.0 76,238.0 36,757.0 112,995.0 Ratios 0.085701 Year 6 1,804.0 LIABILITIES & STOCKHOLDERS' EQUITY Accounts Payable Short-Term Debt Total Current Liabilities Long-Term Debt Total Liabilities Shareholders' Equity Common Stock Retained Earnings Total Shareholders' Equity Total Liabilities and Shareholders' Equity 3,041.0 4,647.0 7,688.0 4,091.0 11,779.0 178,328.0 -77,112.0 101,216.0 112,995.0 4,647.0 4,091.0 178,328.0 PART 1 What is the depreciation expense in Year 6? PART 2 What is the interest expense in Year 6? $ PART 3 What is net PP&E in Year 6? $ PART 4 What are retained earnings for Year 6? PART 5 What is the total for the plug variable in Year 6? Check Answer Check


