

Answered step by step
Verified Expert Solution
Question
1 Approved Answer
forget the finding the one internettet forgetowing table receptet themelor ht. O NOT USE THESE DATA IN YOUR POUCES IS ONLY AN ENAME care of
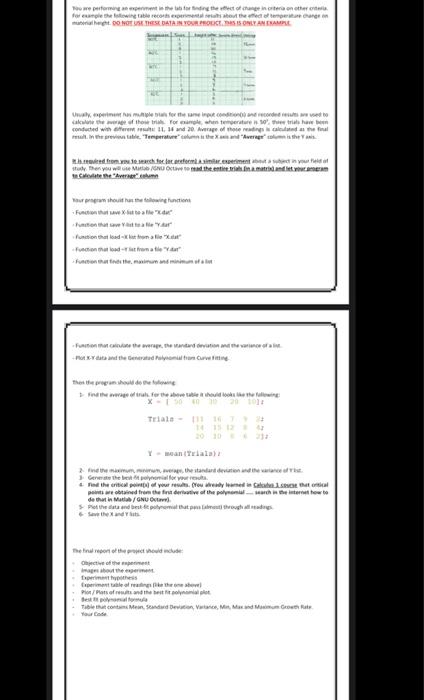
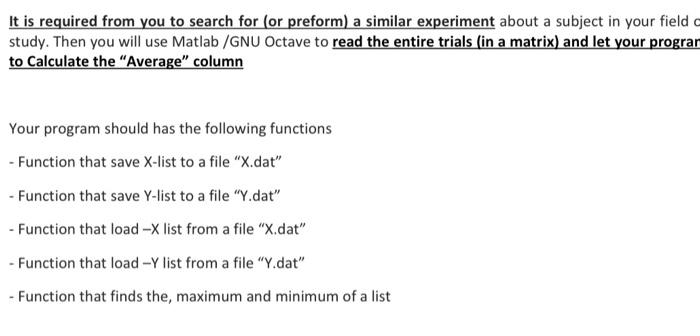
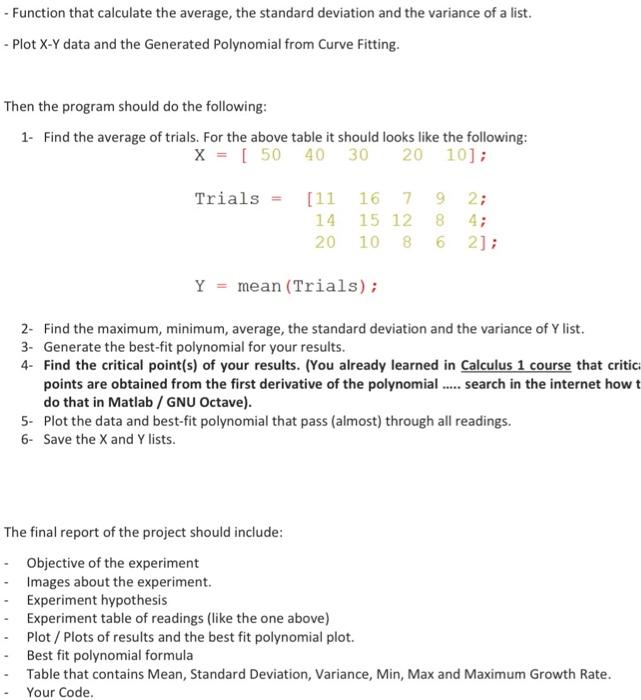
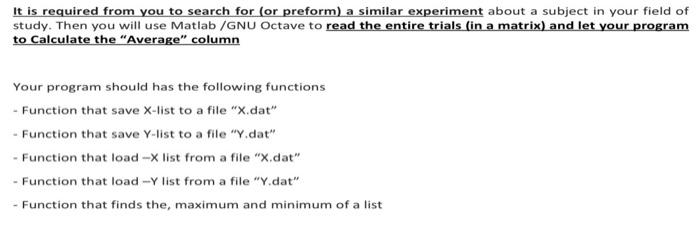
 forget the finding the one internettet forgetowing table receptet themelor ht. O NOT USE THESE DATA IN YOUR POUCES IS ONLY AN ENAME care of how for when temperature otrawbeen conducted worldAfter the final malerie Terettewwerge sed from the bottom rimettent sa Then you wewe uwe tend the entirati uit het These program show de estown Find the way forebietable de la finden, wer the standard deviation de Generell for your red the write your own and the mic its we obtained from the front derative of the polynom heter tow to de that Mata/GNUOtel Pethe data and bude promoting Sex and Ohohet press tale of reading the onesel Pion Plans of the best one Best Table contains Mein Standard Mille It is required from you to search for (or preform) a similar experiment about a subject in your field study. Then you will use Matlab/GNU Octave to read the entire trials (in a matrix) and let your prograr to Calculate the "Average" column Your program should has the following functions - Function that save X-list to a file "X.dat" - Function that save Y-list to a file "Y.dat" - Function that load - list from a file "X.dat" - Function that load - list from a file "Y.dat" - Function that finds the maximum and minimum of a list - Function that calculate the average, the standard deviation and the variance of a list. - Plot X-Y data and the Generated Polynomial from Curve Fitting. Then the program should do the following: 1- Find the average of trials. For the above table it should looks like the following: X = [ 50 40 30 20 10]; Trials = [11 16 792; 15 12 8 20 10 8 6 2]; 14 Y = mean (Trials); 2- Find the maximum, minimum, average, the standard deviation and the variance of Y list. 3- Generate the best-fit polynomial for your results. 4- Find the critical point(s) of your results. (You already learned in Calculus 1 course that critic points are obtained from the first derivative of the polynomial ..... search in the internet how t do that in Matlab / GNU Octave). 5- Plot the data and best-fit polynomial that pass (almost) through all readings. 6- Save the X and Y lists. The final report of the project should include: Objective of the experiment Images about the experiment. Experiment hypothesis Experiment table of readings (like the one above) Plot / Plots of results and the best fit polynomial plot. Best fit polynomial formula Table that contains Mean, Standard Deviation, Variance, Min, Max and Maximum Growth Rate. Your Code. It is required from you to search for (or preform) a similar experiment about a subject in your field of study. Then you will use Matlab /GNU Octave to read the entire trials (in a matrix) and let your program to Calculate the "Average" column Your program should has the following functions - Function that save X-list to a file "X.dat" - Function that save Y-list to a file "Y.dat" - Function that load -> list from a file "X.dat" - Function that load - list from a file "Y.dat" - Function that finds the, maximum and minimum of a list - Function that calculate the average, the standard deviation and the variance of a list. - Plot X-Y data and the Generated Polynomial from Curve Fitting. Then the program should do the following: 1- Find the average of trials. For the above table it should looks like the following: X = [ 50 40 30 20 10]; Trials = [11 16 792; 15 12 8 20 10 8 6 2]; 14 Y = mean (Trials); 2- Find the maximum, minimum, average, the standard deviation and the variance of Y list. 3- Generate the best-fit polynomial for your results. 4- Find the critical point(s) of your results. (You already learned in Calculus 1 course that critic points are obtained from the first derivative of the polynomial ..... search in the internet how t do that in Matlab / GNU Octave). 5- Plot the data and best-fit polynomial that pass (almost) through all readings. 6- Save the X and Y lists. The final report of the project should include: Objective of the experiment Images about the experiment. Experiment hypothesis Experiment table of readings (like the one above) Plot / Plots of results and the best fit polynomial plot. Best fit polynomial formula Table that contains Mean, Standard Deviation, Variance, Min, Max and Maximum Growth Rate. Your Code. forget the finding the one internettet forgetowing table receptet themelor ht. O NOT USE THESE DATA IN YOUR POUCES IS ONLY AN ENAME care of how for when temperature otrawbeen conducted worldAfter the final malerie Terettewwerge sed from the bottom rimettent sa Then you wewe uwe tend the entirati uit het These program show de estown Find the way forebietable de la finden, wer the standard deviation de Generell for your red the write your own and the mic its we obtained from the front derative of the polynom heter tow to de that Mata/GNUOtel Pethe data and bude promoting Sex and Ohohet press tale of reading the onesel Pion Plans of the best one Best Table contains Mein Standard Mille It is required from you to search for (or preform) a similar experiment about a subject in your field study. Then you will use Matlab/GNU Octave to read the entire trials (in a matrix) and let your prograr to Calculate the "Average" column Your program should has the following functions - Function that save X-list to a file "X.dat" - Function that save Y-list to a file "Y.dat" - Function that load - list from a file "X.dat" - Function that load - list from a file "Y.dat" - Function that finds the maximum and minimum of a list - Function that calculate the average, the standard deviation and the variance of a list. - Plot X-Y data and the Generated Polynomial from Curve Fitting. Then the program should do the following: 1- Find the average of trials. For the above table it should looks like the following: X = [ 50 40 30 20 10]; Trials = [11 16 792; 15 12 8 20 10 8 6 2]; 14 Y = mean (Trials); 2- Find the maximum, minimum, average, the standard deviation and the variance of Y list. 3- Generate the best-fit polynomial for your results. 4- Find the critical point(s) of your results. (You already learned in Calculus 1 course that critic points are obtained from the first derivative of the polynomial ..... search in the internet how t do that in Matlab / GNU Octave). 5- Plot the data and best-fit polynomial that pass (almost) through all readings. 6- Save the X and Y lists. The final report of the project should include: Objective of the experiment Images about the experiment. Experiment hypothesis Experiment table of readings (like the one above) Plot / Plots of results and the best fit polynomial plot. Best fit polynomial formula Table that contains Mean, Standard Deviation, Variance, Min, Max and Maximum Growth Rate. Your Code. It is required from you to search for (or preform) a similar experiment about a subject in your field of study. Then you will use Matlab /GNU Octave to read the entire trials (in a matrix) and let your program to Calculate the "Average" column Your program should has the following functions - Function that save X-list to a file "X.dat" - Function that save Y-list to a file "Y.dat" - Function that load -> list from a file "X.dat" - Function that load - list from a file "Y.dat" - Function that finds the, maximum and minimum of a list - Function that calculate the average, the standard deviation and the variance of a list. - Plot X-Y data and the Generated Polynomial from Curve Fitting. Then the program should do the following: 1- Find the average of trials. For the above table it should looks like the following: X = [ 50 40 30 20 10]; Trials = [11 16 792; 15 12 8 20 10 8 6 2]; 14 Y = mean (Trials); 2- Find the maximum, minimum, average, the standard deviation and the variance of Y list. 3- Generate the best-fit polynomial for your results. 4- Find the critical point(s) of your results. (You already learned in Calculus 1 course that critic points are obtained from the first derivative of the polynomial ..... search in the internet how t do that in Matlab / GNU Octave). 5- Plot the data and best-fit polynomial that pass (almost) through all readings. 6- Save the X and Y lists. The final report of the project should include: Objective of the experiment Images about the experiment. Experiment hypothesis Experiment table of readings (like the one above) Plot / Plots of results and the best fit polynomial plot. Best fit polynomial formula Table that contains Mean, Standard Deviation, Variance, Min, Max and Maximum Growth Rate. Your Code
Step by Step Solution
There are 3 Steps involved in it
Step: 1

Get Instant Access to Expert-Tailored Solutions
See step-by-step solutions with expert insights and AI powered tools for academic success
Step: 2

Step: 3
Ace Your Homework with AI
Get the answers you need in no time with our AI-driven, step-by-step assistance
Get Started
Intelligent Image Databases Towards Advanced Image Retrieval
Authors: Yihong Gong
1st Edition
1461375037, 978-1461375036