Question
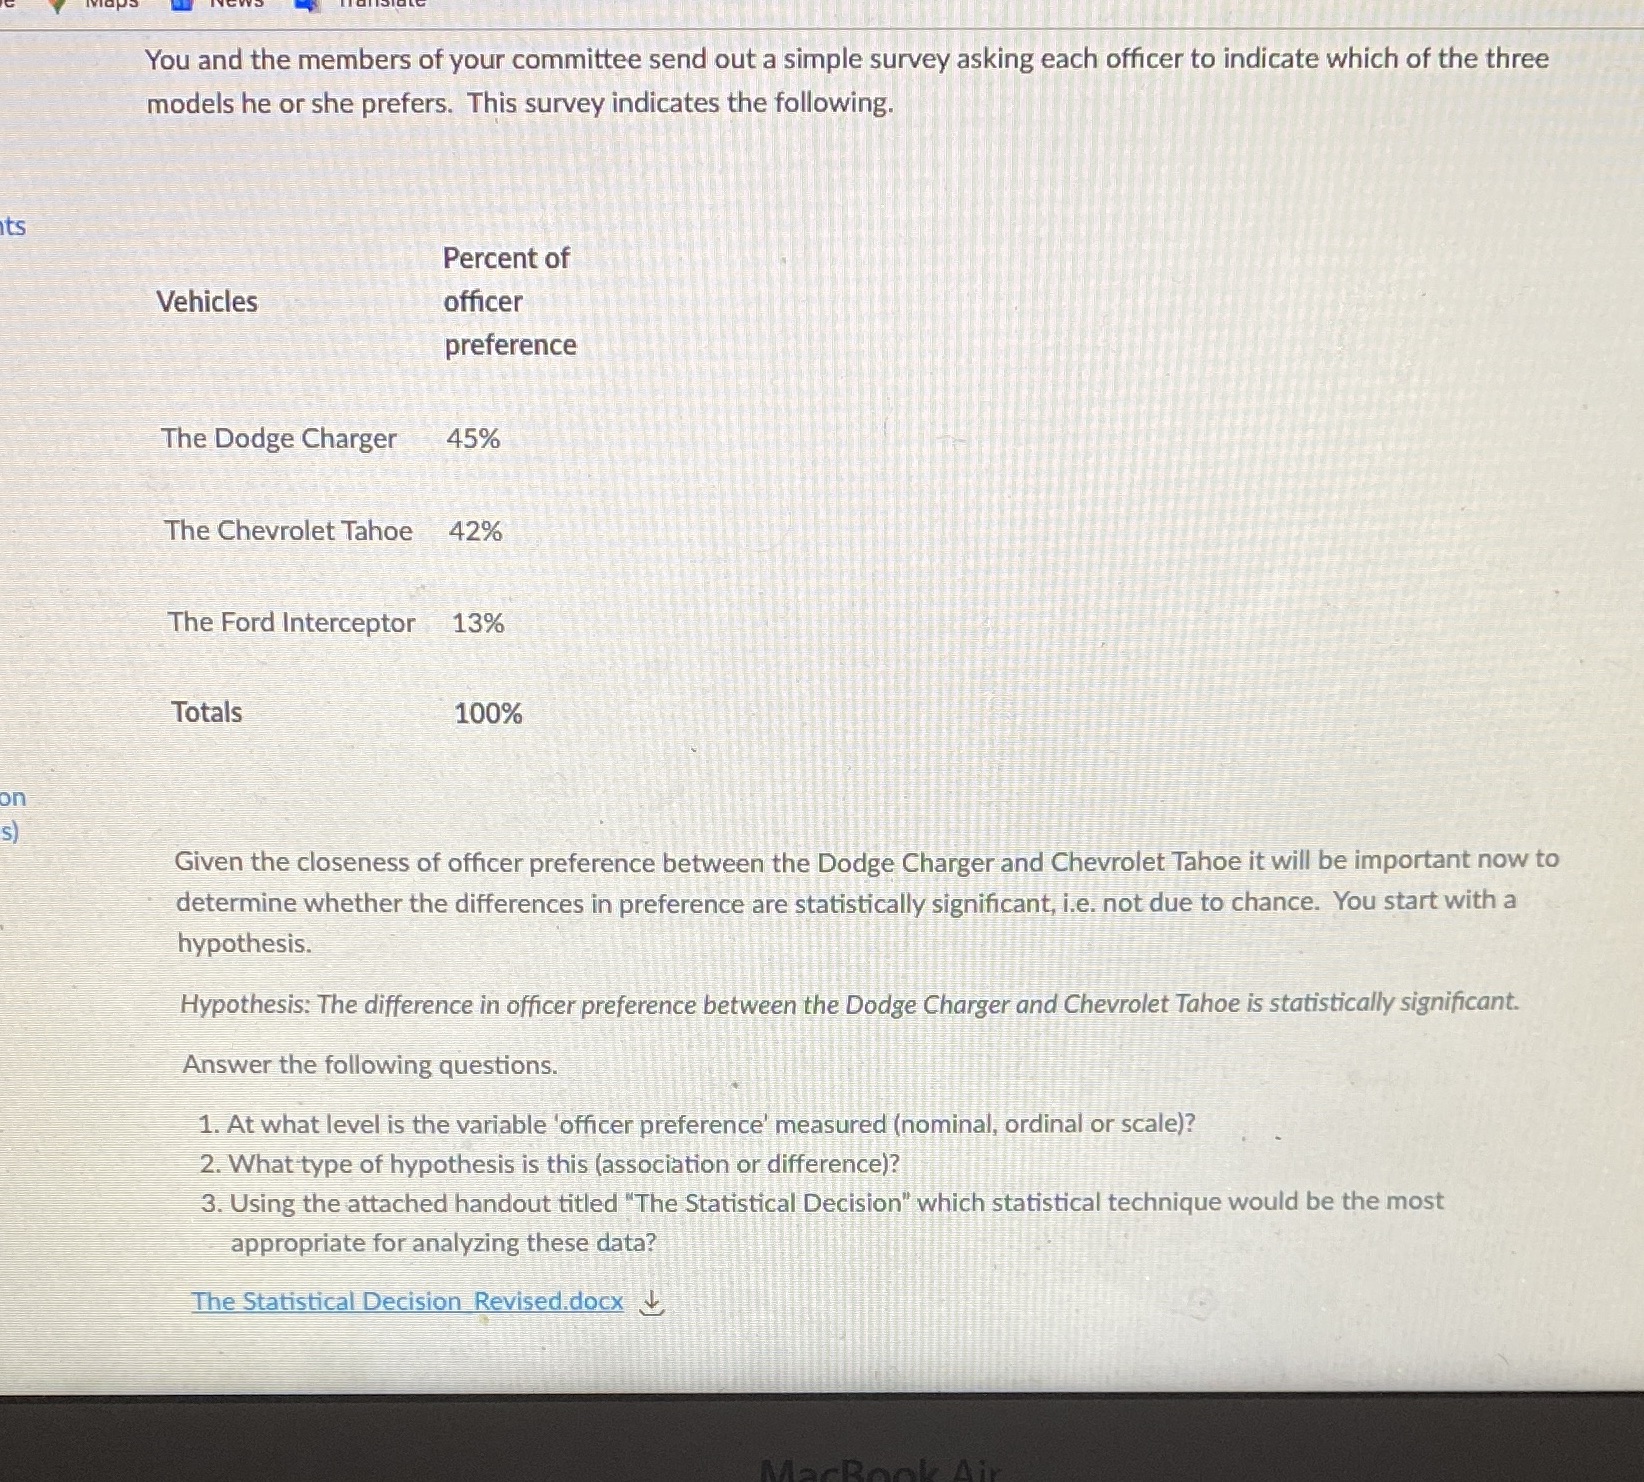
Fourth, using the information you now have use the following outline to identify the most appropriate statistical technique.1. For a hypothesis of difference,a. If the
Fourth, using the information you now have use the following outline to identify the most appropriate statistical technique.1. For a hypothesis of difference,a. If the independent and dependent variables are both measured at the nominal level of measurement, use a Chi-Square model.b. If the independent variable is measured at the nominal level of measurement and the dependent variable is measured at the scale level of measurement,i. Use a t-test model when there are two groups to compare, orii. Use an Analysis of Variance (F-ratio) model if there are more than two groups to compare.2. For a hypothesis of association,a. If the independent and dependent variables are both measured at the scale level of measurement, use a Pearson R model.b. If the independent and dependent variables are both measured at the scale level of measurement and you want to use the independent variables to predict the value of the dependent variable, use a Regression model.

Step by Step Solution
There are 3 Steps involved in it
Step: 1

Get Instant Access to Expert-Tailored Solutions
See step-by-step solutions with expert insights and AI powered tools for academic success
Step: 2

Step: 3

Ace Your Homework with AI
Get the answers you need in no time with our AI-driven, step-by-step assistance
Get Started


