

FOXCORE RETAIL (A): DESIGNING A DATABASE On April 2, 2017, Liam Corrigan and Mitchell Fox were wrapping up a weekend-long meeting discussing their upcoming summer
FOXCORE RETAIL (A): DESIGNING A DATABASE
On April 2, 2017, Liam Corrigan and Mitchell Fox were wrapping up a weekend-long meeting discussing their upcoming summer plans. The two business partners were preparing for a third year managing their small retail business and had spent the weekend reviewing budgeting, staffing schedules, and inventory planning for their biggest expansion to date. There was only one pressing concern that had not been solved. In the past, employees had tracked sales by hand, on paper, which led to headaches when it came to calculating sales representatives commissions. Additionally, the two partners knew that by not documenting key information about each sale, they were missing the opportunity to collect valuable data that could provide insight into the performance of employees, events, and products. As the business grew, Corrigan and Fox were starting to notice the impact of these inefficiencies on customer service, and it was clear that this was the right time to implement a more disciplined database system. FOXCORE HISTORY As roommates, Corrigan and Fox had often talked about starting a business together. After graduating from the University of Western Ontario, the two friends decided to test their entrepreneurial skills by starting a small retail business selling inexpensive novelty items at music festivals and tradeshows. Inspired by his previous job in Western Canada selling childrens toys, Fox suggested they start by selling Bubble Guns, a hand-held electric toy that had been wildly popular at shows such as the Calgary Stampede (see Exhibit 1). While in Alberta, Fox had discovered another popular product, Arctic Skin Cooling Towels, a product that once wetted stayed cool for several hours (see Exhibit 2). Fox had already built a relationship with the owner of the Arctic Skin Cooling Towels, and the two young entrepreneurs decided it would be a great product to bring to Ontario. Using a combination of their last names, Corrigan and Fox decided to call their new venture Foxcore Retail (Foxcore). The two began searching for suppliers and negotiating with festival organizers to test the viability of their business idea. They began by setting up pop-up shops at summer music festivals and weekend trade shows across Ontario, demonstrating and selling their products in-person (see Exhibit 3). Corrigan and Fox often joked that they had become carniesa slang term for travelling carnival workers. Travelling to different cities across Ontario, attending events ranging from local rib fests to fitness expos to large music festivals, the two partners quickly became familiar with the most popular event venues and their organizers.
As sales grew, their idea proved to be more successful than either of the two partners had imagined. They were often so swamped with setting up Bubble Guns for customers that they were unable to demonstrate the Arctic Skin Cooling Towels. They hired several salespeople to help them handle the high demand, paying commissions to directly incentivize performance. They also sensed a strong opportunity to add more products to their lineup, tailored toward specific kinds of shows. They began testing a variety of new products, such as emoji pillows, heating pads, and remote-controlled drones, and tried to figure out which products worked best at which shows. By its second year, Foxcore had expanded. Corrigan and Fox were managing up to three shows per weekend, with multiple booths at some venues. Things were going very well for the two entrepreneurs. However, their manual sales-tracking system was beginning to cause problems. Sales were recorded on paper, and then sales totals were transposed into Excel spreadsheets. Over time, more and more disparate worksheets were created that contained details such as event information, sales, employee commissions, and product data. Keeping track of all the information was becoming a major administrative hassle, and errors were occurring. The partners realized that something had to be done if they hoped to continue expanding their business into year three. However, dealing with the problem kept being delayed in favour of solving more immediate day-to-day business issues. THE PROBLEM It was almost the beginning of the third summer for Foxcore. The first two events of the season were only a month away, and Corrigan and Fox were determined to bring some order to their data collection activities. Information stored in different spreadsheets was becoming increasingly difficult to use for routine business operations, and it was not providing strategic insights. Despite having collected and stored essential data, the inability to access and analyze the information resulted in sub-optimal decisionmaking for both short- and long-term planning. During the first two years of operations, each sales consultant had kept a record of each sale on paper, which was then tallied each day to calculate commissions. In a hectic sales environment, however, not all sales were recorded by the consultants, which resulted in lost commissions and unreliable inventory estimates without a clear record of exactly what was sold. With 17 full-time sales consultants hired for the third season and over 28 products available for sale at various shows across the province, Corrigan and Fox needed to track exact details about which products were soldby whom, when, and where. Having completed a data management course at Ivey Business School, Corrigan knew that a custom database would provide a solution for tracking the different types of business information the two partners were collecting. However, with less than 30 days remaining before the festival season began, Corrigan was running out of time. In the interest of saving time, he considered quickly building database tables on his own and setting up relationships based on intuition (known as hacking out a database). However, he knew this could eventually lead to serious problems with efficiency and data integrity. To do this properly, he needed to start with a solid conceptual data model. DESIGNING THE DATABASE The first step was to understand the basic data requirements. Corrigan and Fox listed all key types of information that could be captured by a database to represent their companys operations. Their main focus was to design a system that could track events, sales consultants, and individual sales of different products. Through initial brainstorming, they identified six main categories of essential information:
Event: Several pieces of information were needed to be stored under the category of events, such as the event name, start and end dates, and a brief description. It had been helpful in the past to know the event type, when determining which products to offer there. The two partners had found that most events could be classified under one of seven categories: trade show, rib fest, waterfront festival, music festival, beer festival, sporting event, or street festival. Venue: Each event had its own venue name and address, and sometimes a description with further instructions such as where to park. It was important to store this information separately, because multiple events could occur at the same venue during a given season. Booth: There was always at least one booth set up at an event. Depending on the size of the show, however, additional booths could be set up to create more sales opportunities. Each booth was set up at an assigned location at the event (e.g., S11 referred to row S, section 11). Product: Every type of product that was sold at an event had a wholesale cost and a minimum selling price. Employees were encouraged to start with a higher price when selling products and to cut deals to help close sales. Salesperson: Corrigan and Fox hired sales consultants to work in shifts at each booth. Each sales consultant would spend the entire shift working at one booth. Employee information included first name, last name, and usually the address and phone number of each consultant. Sales consultants could work multiple shifts, but every shift would take place at only one booth. Corrigan and Fox wanted to record in the database who was working at each booth during the day, and at what time. Sales: The goal of each employee was to generate sales throughout each shift. Corrigan and Fox wanted to track the sales for each employee, for every shift worked. It was also important to record the product that was sold, along with the quantity sold and the final selling price. Furthermore, they needed to be able to track sales by event (i.e., sales quantity of a particular product at a particular event). WHAT NEXT? Corrigan and Fox reviewed their list of requirements and felt that it clearly represented what they needed to track. Corrigan knew that the next step would be challenging: break down the list into entities and attributes, and identify the relationships between them. This step was difficult because there was not necessarily one right answerdifferent valid data models could be designed. That said, he also knew that a properly designed data model would eliminate redundancies and make the database implementation process much more efficient, and he wanted to take the time to do it right. Corrigan had done some research into common data modelling approaches and decided that designing the model using Barkers notation would be the best way to visualize the Foxcore database.1 With all the tools in hand, Corrigan sat down and began sketching out a preliminary data model.
EXHIBIT 1: BUBBLE GUN

EXHIBIT 2: ARCTIC COOLING TOWEL
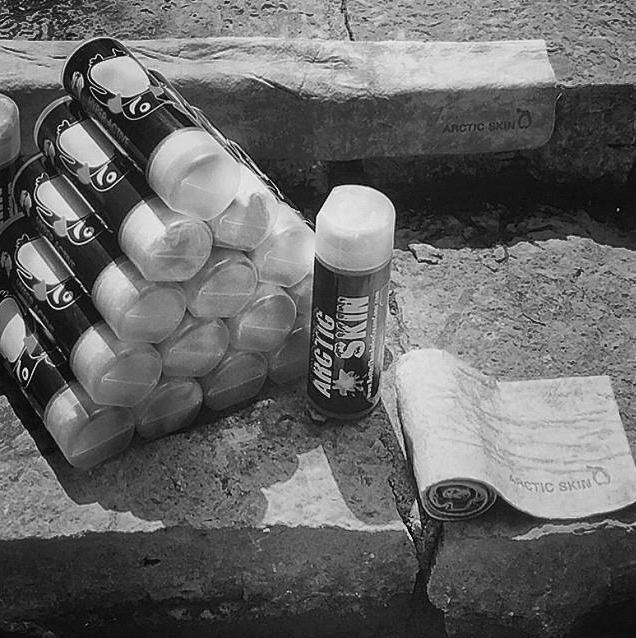
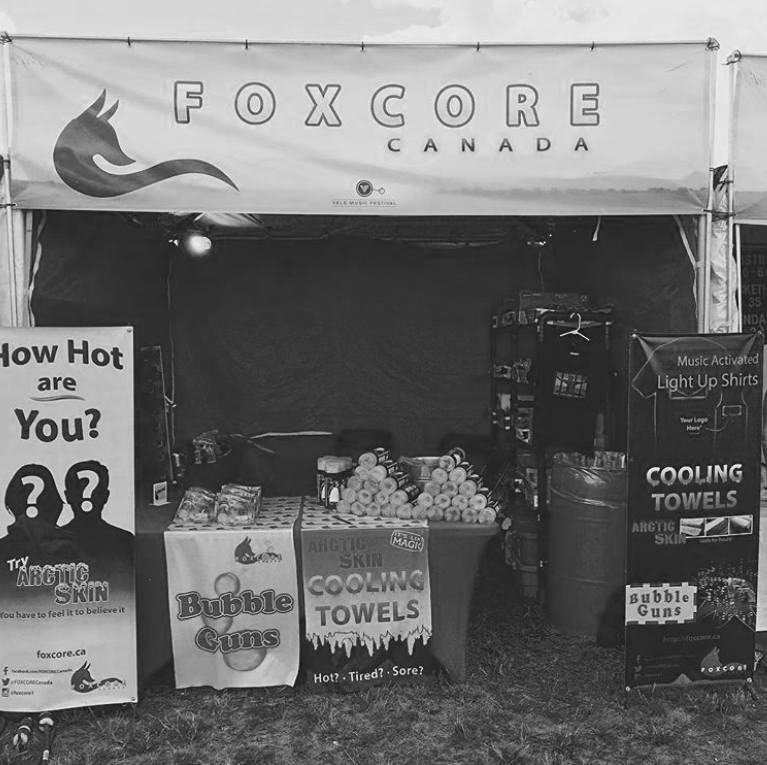
EXHIBIT 3: THE BOOTH
Use Case: Foxcore Retail (A): Designing a Database BY Derrick Neufeld, Liam Corrigan, Michael Gencarelli 1. What were the operational challenges for FOXCORE in early two years? Also provide suggestions to resolve such challenges. 2. Identify Entities, Attributes, and Relationships based on the business requirements. 3. Develop relational data model for the given case. What are the benefits of performing this step? 4. Develop Database schema for the given case 5. Write Data definition commands for this database.
G TO ARCTIC SKIN 2 lo SKIN ARGTIG Befoane ARCTIC SKIT F O X C O R E CANADA MUS STE D-6 KET 35 INDA How Hot Music Activated Light Up Shirts are You? TD Your Lage Mer ?? COOLING TOWELS ARCTIC SKIP whit TARCTIC SKIN ARCTIC MAGIO SKIN Bubble COOLING TOWELS Cuns Bubble Guns You have to feel it to believe it foxcore.ca f Orco1 FORO . Hot?. Tired?. SoreStep by Step Solution
There are 3 Steps involved in it
Step: 1

See step-by-step solutions with expert insights and AI powered tools for academic success
Step: 2

Step: 3
Ace Your Homework with AI
Get the answers you need in no time with our AI-driven, step-by-step assistance
Get Started
Authors: Kam-Yiu Lam ,Tei-Wei Kuo
1st Edition
1475784023, 978-1475784022