Answered step by step
Verified Expert Solution
Question
1 Approved Answer
Freddys Fried Chicken provides the following for the months of April and May: d. Compare the information you received from the common-size vertical analysis and
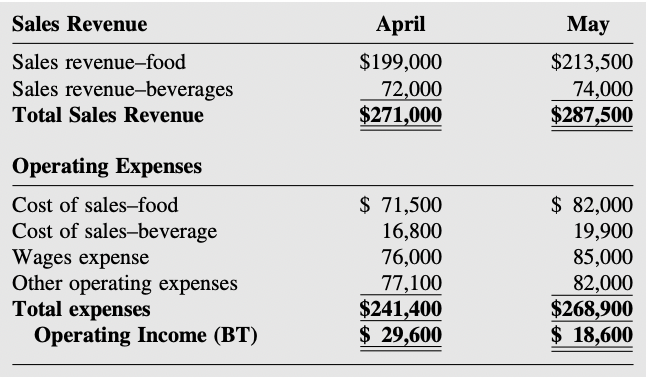
Freddys Fried Chicken provides the following for the months of April and May:

d. Compare the information you received from the common-size vertical analysis and the comparative horizontal analysis.
Sales Revenue Sales revenue-food Sales revenue-beverages Total Sales Revenue April $199,000 72,000 $271,000 May $213,500 74,000 $287,500 Operating Expenses Cost of sales-food Cost of sales-beverage Wages expense Other operating expenses Total expenses Operating Income (BT) $ 71,500 16,800 76,000 77,100 $241,400 $ 29,600 $ 82,000 19,900 85,000 82,000 $268,900 $ 18,600Step by Step Solution
There are 3 Steps involved in it
Step: 1

Get Instant Access to Expert-Tailored Solutions
See step-by-step solutions with expert insights and AI powered tools for academic success
Step: 2

Step: 3

Ace Your Homework with AI
Get the answers you need in no time with our AI-driven, step-by-step assistance
Get Started


