

Answered step by step
Verified Expert Solution
Question
1 Approved Answer
Frizell Company has the following comparative balance sheet data. FRIZELL COMPANY Balance Sheets December 31 2017 2016 Cash $ 15,000 30,500 Accounts receivable (net) 69,100
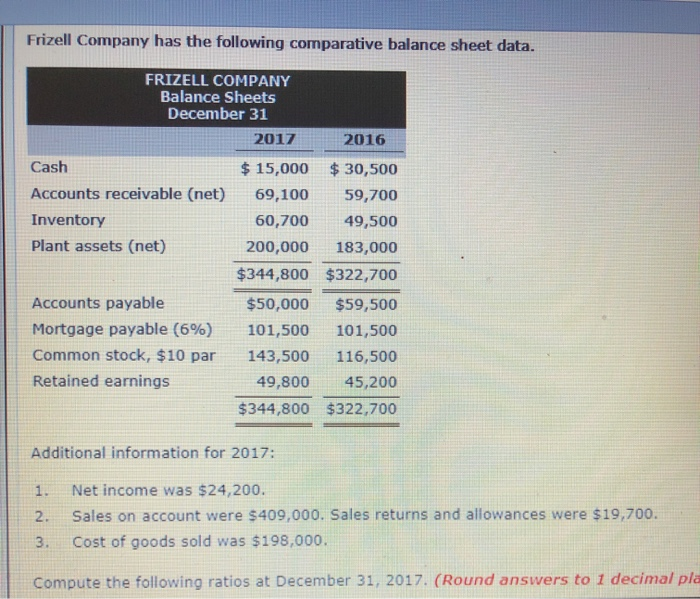
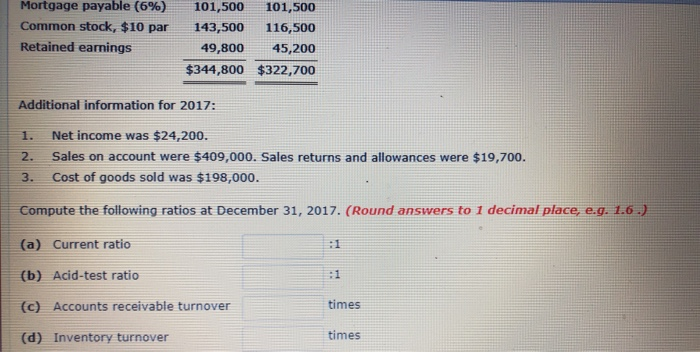 Frizell Company has the following comparative balance sheet data. FRIZELL COMPANY Balance Sheets December 31 2017 2016 Cash $ 15,000 30,500 Accounts receivable (net) 69,100 59,700 60,700 49,500 200,000 183,000 $344,800 $322,700 $50,000 $59,500 Mortgage payable (696) 101,500 101,500 Common stock, $10 par 143,500 116,500 49,80045,200 $344,800 $322,700 Inventory Plant assets (net) Accounts payable Retained earnings Additional information for 2017: 1. Net income was $24,200. 2. Sales on account were $409,000. Sales returns and allowances were $19,700. 3. Cost of goods sold was $198,000. Compute the following ratios at December 31, 2017. (Round answers to 1 decimal pla Mortgage payable (696) Common stock, $10 par Retained earnings 101,500 143,500 49,800 $344,800 101,500 116,500 45,200 $322,700 Additional information for 2017: 1. Net income was $24,200. 2. Sales on account were $409,000. Sales returns and allowances were $19,700 3. Cost of goods sold was $198,000. Compute the following ratios at December 31, 2017. (Round answers to 1 decimal place, e.g. 1.6.) (a) Current ratio (b) Acid-test ratio (c) Accounts receivable turnover (d) Inventory turnover times times
Step by Step Solution
There are 3 Steps involved in it
Step: 1

Get Instant Access to Expert-Tailored Solutions
See step-by-step solutions with expert insights and AI powered tools for academic success
Step: 2

Step: 3
Ace Your Homework with AI
Get the answers you need in no time with our AI-driven, step-by-step assistance
Get Started
Human And Social Audit
Authors: N P Agarwal
1st Edition
8176113980, 978-8176113984