

Answered step by step
Verified Expert Solution
Question
1 Approved Answer
From General motors info above of debt level and the corporations share price, what should be the firm optimal capital structure? Justify your answer through
From General motors info above of debt level and the corporations share price, what should be the firm optimal capital structure? Justify your answer through graph
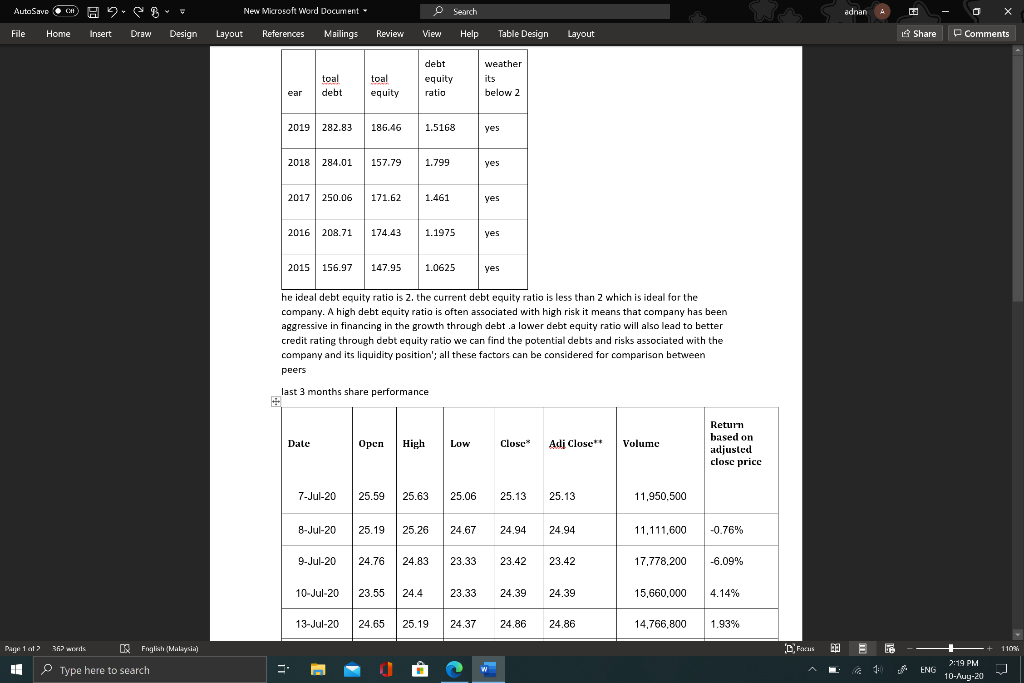
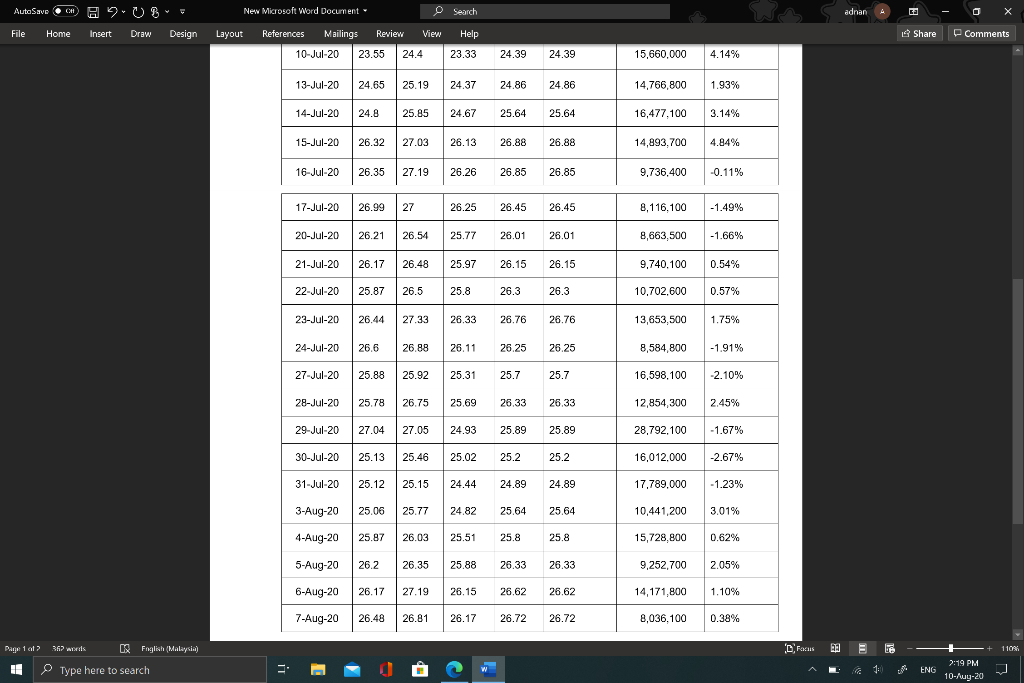
AutoSave CH HEB- New Microsoft Word Document - O Search adnan 4 ca File Home Insert Draw Design Layout References Mailings Review View Help Table Design Layout Share Comments debt toal debt toal equity equity ratio weather its below 2 ear 2019 282.83 186.46 1.5168 yes 2018 284.01 157.79 1.799 yes 2017 250.06 171.62 1.461 yes 2016 208.71 174.43 1.1975 yes 2015 156.97 147.95 1.0625 yes he ideal debt equity ratio is 2. the current debt equity ratio is less than 2 which is ideal for the company. A high debt equity ratio is often associated with high risk it means that company has been aggressive in financing in the growth through debt .a lower debt equity ratio will also lead to better credit rating through debt equity ratio we can find the potential debts and risks associated with the company and its liquidity position'; all these factors can be considered for comparison between peers last 3 months share performance Date Open High Low Close Adj Close Volume Return based on adjusted close price 7-Jul-20 25.59 25.63 25.06 25.13 25.13 11,950.500 8-Jul-20 25.19 25.26 24.67 24.94 24.94 11,111,600 -0.76% 9-Jul-20 24.76 24.83 23.33 23.42 23.42 17,778.200 -6.09% 10-Jul-20 23.55 24.4 23.33 24.39 24.39 15,660,000 4.14% 13-Jul-20 24.65 25.19 24.37 24.86 24.86 14,766,800 1.93% Page 1 of 2 367 was og Foglich (Malaysia) D Focus 12 E be .+ 1106 I Type here to search 2 1 ENG 2:49 PM 10-Aug-20 AutoSave CH HUB New Microsoft Word Document - O Search adnan 4 ca 0 X File Home Insert Draw Design Layout References Mailings Review View Share Comments Help 23.33 10-Jul-20 23.55 24.4 24.39 24.39 15,660,000 4.14% 13-Jul-20 24.65 25.19 24.37 24.86 24.86 14.766.800 1.93% 14-Jul-20 24.8 25.85 24.67 25.64 25.64 16,477.100 3.14% 15-Jul-20 26.32 27.03 26.13 26.88 26.88 14.893.700 4.84% 16-Jul-20 26.35 27.19 26.26 26.85 26.85 9,736,400 -0.11% 17-Jul-20 26.99 27 26.25 26.45 26.45 8,116.100 -1.49% 20-Jul-20 26.21 26.54 25.77 26.01 26.01 8,663,500 -1.66% 21-Jul-20 26.17 26.48 25.97 26.15 26.15 9,740.100 0.54% 22-Jul-20 25.87 26.5 25.8 26.3 26.3 10,702,600 0.57% 26.5 23-Jul-20 26.44 27.33 26.33 26.76 26.76 13,653,500 1.75% 24-Jul-20 26.6 26.88 26.11 26.25 26.25 8,584.800 -1.91% 27-Jul-20 25.88 25.92 25.31 25.7 25.7 16,598,100 -2.10% 28-Jul-20 25.78 26.75 25.69 26.33 26.33 12,854,300 2.45% 29-Jul-20 27.04 27.05 24.93 25.89 25.89 28,792, 100 -1.67% 30-Jul-20 25.13 25.46 25.02 25.2 25.2 16,012.000 -2.67% 31-Jul-20 25.12 25.15 24.44 24.89 24.89 17,789,000 -1.23% 3-Aug-20 25.06 25.77 24.82 25,64 25.64 10.441.200 3.01% 4-Aug-20 25.87 26.03 25.51 25.8 25.8 15,728,800 0.62% 5-Aug-20 26.2 26.35 25.88 26.33 26.33 9,252,700 2.05% 6-Aug-20 26.17 27.19 26.15 26.62 26.62 14,171,800 1.10% 7-Aug-20 26.48 26.81 26.17 26.72 26.72 8,036,100 0.38% Page 1 of 2 367 was og Foglich (Malaysia) D Focus 12 E be .+ 1106 I Type here to search 2 1: ENG 2:49 PM 10-Aug-20 AutoSave CH HEB- New Microsoft Word Document - O Search adnan 4 ca File Home Insert Draw Design Layout References Mailings Review View Help Table Design Layout Share Comments debt toal debt toal equity equity ratio weather its below 2 ear 2019 282.83 186.46 1.5168 yes 2018 284.01 157.79 1.799 yes 2017 250.06 171.62 1.461 yes 2016 208.71 174.43 1.1975 yes 2015 156.97 147.95 1.0625 yes he ideal debt equity ratio is 2. the current debt equity ratio is less than 2 which is ideal for the company. A high debt equity ratio is often associated with high risk it means that company has been aggressive in financing in the growth through debt .a lower debt equity ratio will also lead to better credit rating through debt equity ratio we can find the potential debts and risks associated with the company and its liquidity position'; all these factors can be considered for comparison between peers last 3 months share performance Date Open High Low Close Adj Close Volume Return based on adjusted close price 7-Jul-20 25.59 25.63 25.06 25.13 25.13 11,950.500 8-Jul-20 25.19 25.26 24.67 24.94 24.94 11,111,600 -0.76% 9-Jul-20 24.76 24.83 23.33 23.42 23.42 17,778.200 -6.09% 10-Jul-20 23.55 24.4 23.33 24.39 24.39 15,660,000 4.14% 13-Jul-20 24.65 25.19 24.37 24.86 24.86 14,766,800 1.93% Page 1 of 2 367 was og Foglich (Malaysia) D Focus 12 E be .+ 1106 I Type here to search 2 1 ENG 2:49 PM 10-Aug-20 AutoSave CH HUB New Microsoft Word Document - O Search adnan 4 ca 0 X File Home Insert Draw Design Layout References Mailings Review View Share Comments Help 23.33 10-Jul-20 23.55 24.4 24.39 24.39 15,660,000 4.14% 13-Jul-20 24.65 25.19 24.37 24.86 24.86 14.766.800 1.93% 14-Jul-20 24.8 25.85 24.67 25.64 25.64 16,477.100 3.14% 15-Jul-20 26.32 27.03 26.13 26.88 26.88 14.893.700 4.84% 16-Jul-20 26.35 27.19 26.26 26.85 26.85 9,736,400 -0.11% 17-Jul-20 26.99 27 26.25 26.45 26.45 8,116.100 -1.49% 20-Jul-20 26.21 26.54 25.77 26.01 26.01 8,663,500 -1.66% 21-Jul-20 26.17 26.48 25.97 26.15 26.15 9,740.100 0.54% 22-Jul-20 25.87 26.5 25.8 26.3 26.3 10,702,600 0.57% 26.5 23-Jul-20 26.44 27.33 26.33 26.76 26.76 13,653,500 1.75% 24-Jul-20 26.6 26.88 26.11 26.25 26.25 8,584.800 -1.91% 27-Jul-20 25.88 25.92 25.31 25.7 25.7 16,598,100 -2.10% 28-Jul-20 25.78 26.75 25.69 26.33 26.33 12,854,300 2.45% 29-Jul-20 27.04 27.05 24.93 25.89 25.89 28,792, 100 -1.67% 30-Jul-20 25.13 25.46 25.02 25.2 25.2 16,012.000 -2.67% 31-Jul-20 25.12 25.15 24.44 24.89 24.89 17,789,000 -1.23% 3-Aug-20 25.06 25.77 24.82 25,64 25.64 10.441.200 3.01% 4-Aug-20 25.87 26.03 25.51 25.8 25.8 15,728,800 0.62% 5-Aug-20 26.2 26.35 25.88 26.33 26.33 9,252,700 2.05% 6-Aug-20 26.17 27.19 26.15 26.62 26.62 14,171,800 1.10% 7-Aug-20 26.48 26.81 26.17 26.72 26.72 8,036,100 0.38% Page 1 of 2 367 was og Foglich (Malaysia) D Focus 12 E be .+ 1106 I Type here to search 2 1: ENG 2:49 PM 10-Aug-20Step by Step Solution
There are 3 Steps involved in it
Step: 1

Get Instant Access to Expert-Tailored Solutions
See step-by-step solutions with expert insights and AI powered tools for academic success
Step: 2

Step: 3
Ace Your Homework with AI
Get the answers you need in no time with our AI-driven, step-by-step assistance
Get Started
The Nursing Audit Self Regulation In Nursing Practice
Authors: Maria C Phaneuf
2nd Edition
0838570054, 978-0838570050