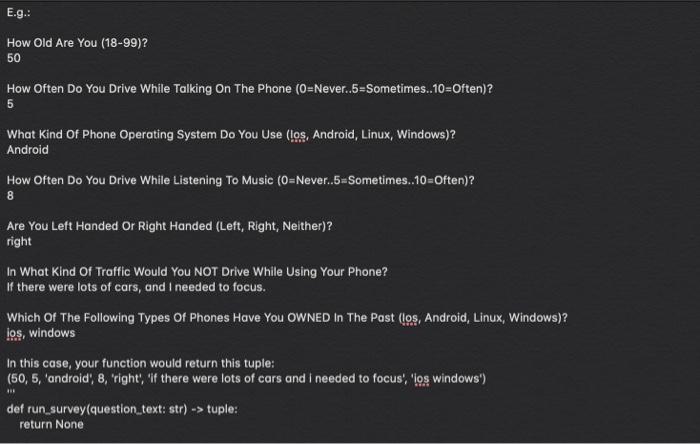
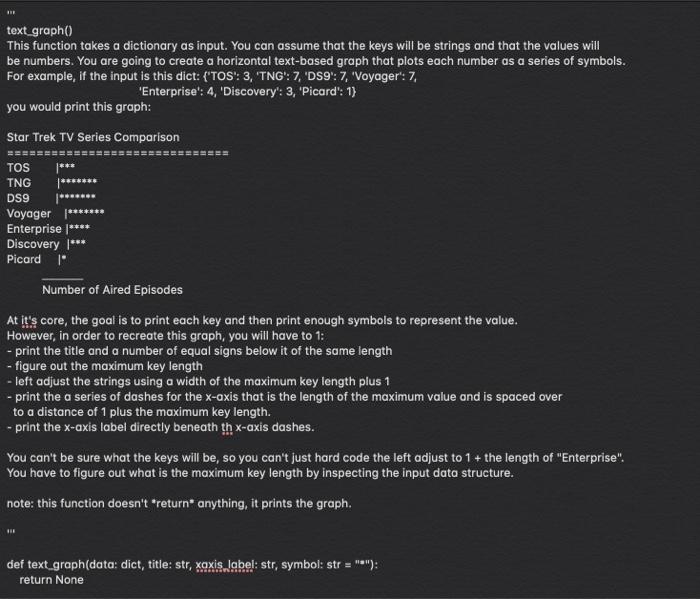
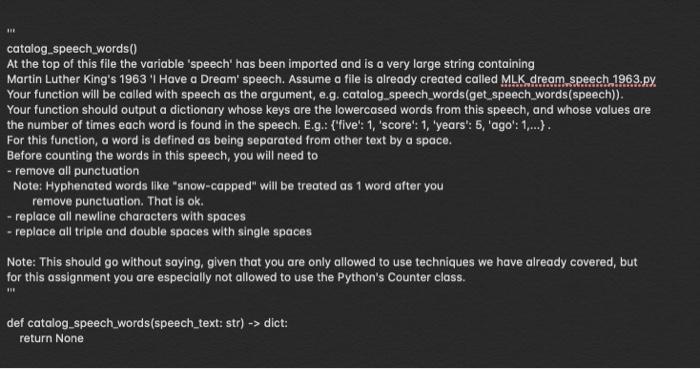
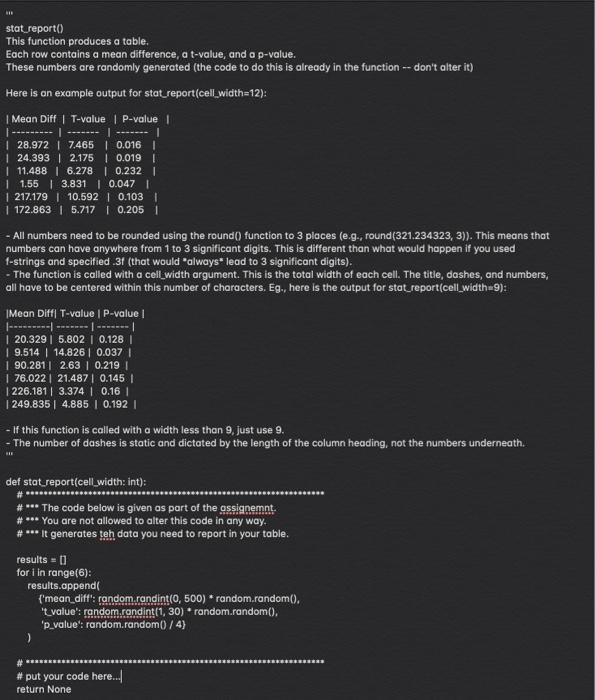
from pprint import pprint from copy import deepcopy import string import random from MLK_dream_speech_1963 import speech # These are 'global' variable that are automatically available to all functions. # DO NOT ALTER ANY GLOBAL VARIABLE IN ANY OF YOUR CODE!! # *weese raw_questions BRE how old are you (18-99)? how often do you drive while talking on the phone (O=Never..5=Sometimes.10=Often)? what kind of phone operating system do you use (ios, android, linux, windows)? how often do you drive while listening to music (O=Never..5=Sometimes..10=Often)? are you left handed or right handed (left, right, neither)? in what kind of traffic would you _not_drive while using your phone? Which of the following types of phones have you _owned_in the past (ios, android, linux, windows)? 11 run_survey This function will be called with a string similar to the one in the global variable 'raw_questions' defined above. Your function will need to iterate over the questions in raw_questions and pose each to the participant (all words in each question should be converted to title case (unless the word is surrounded by "_"). If any word in a question is surrounded by "-", then you are to remove those characters and uppercase that word. No question will every have more than one word surrounded by "_"! (note: I strongly recommend implementing this requirement at the end, after everything else is working). After the participant enters their response, you are to store each response in a list. Before you store the response in the list: - Remove leading and trailing spaces. - Remove any commas or periods. - Convert any double spaces to single spaces. - Lowercase the string. If the response is a number (i.e., only contains digits), you are to store the response as an integer, otherwise, store it as a string. Your function returns a tuple containing the responses. There is no error checking in this function...store whatever the user enters -- even if they enter nothing. E.g.: How Old Are You (18-99)? 50 How often Do You Drive While Talking On The Phone (O=Never..5=Sometimes..10=Often)? 5 What kind of Phone Operating System Do You Use (los, Android, Linux, Windows)? Android How often Do You Drive While Listening To Music (O=Never..5=Sometimes..10=Often)? 8 Are You Left Handed Or Right Handed (Left, Right, Nether)? right In What Kind Of Traffic Would You NOT Drive While Using Your Phone? If there were lots of cars, and I needed to focus. Which Of The Following Types Of Phones Have You OWNED In The Past (los, Android, Linux, Windows)? los, windows In this case, your function would return this tuple: (50, 5, android, 8, 'right', 'if there were lots of cars and I needed to focus', 'los windows') def run_survey(question text: str) -> tuple: return None text_graph) This function takes a dictionary as input. You can assume that the keys will be strings and that the values will be numbers. You are going to create a horizontal text-based graph that plots each number as a series of symbols. For example, if the input is this dict: (TOS": 3, 'TNG': 7, "DS9": 7, "Voyager': 7, 'Enterprise": 4, "Discovery': 3, "Picard": 1} you would print this graph: Star Trek TV Series Comparison ======== TOS TNG DS9 Voyager |*** Enterprise **** Discovery |*** Picard 1" Number of Aired Episodes At it's core, the goal is to print each key and then print enough symbols to represent the value. However, in order to recreate this graph, you will have to 1: - print the title and a number of equal signs below it of the same length - figure out the maximum key length - left adjust the strings using a width of the maximum key length plus 1 - print the a series of dashes for the x-axis that is the length of the maximum value and is spaced over to a distance of 1 plus the maximum key length. - print the x-axis label directly beneath th x-axis dashes. You can't be sure what the keys will be, so you can't just hard code the left adjust to 1 + the length of "Enterprise". You have to figure out what is the maximum key length by inspecting the input data structure. note: this function doesn't return anything, it prints the graph. def text_graph(data: dict, title: str, xaxis label: str, symbol: str = ""): return None BE catalog.speech_words() At the top of this file the variable 'speech' has been imported and is a very large string containing Martin Luther King's 1963 'I Have a Dream' speech. Assume a file is already created called MLK dream speech 1963.py. Your function will be called with speech as the argument, e.g. catalog_speech_words(get_speech_words(speech)). Your function should output a dictionary whose keys are the lowercased words from this speech, and whose values are the number of times each word is found in the speech. E.g.: ('five': 1, 'score': 1, 'years': 5, 'ago': 1,...). For this function, a word is defined as being separated from other text by a space. Before counting the words in this speech, you will need to - remove all punctuation Note: Hyphenated words like "snow-capped" will be treated as 1 word after you remove punctuation. That is ok. - replace all newline characters with spaces - replace all triple and double spaces with single spaces Note: This should go without saying, given that you are only allowed to use techniques we have already covered, but for this assignment you are especially not allowed to use the Python's Counter class. def catalog_speech_words(speech_text: str) -> dict: return None stat_report() This function produces a table. Each row contains a mean difference, a t-value, and a p-value. These numbers are randomly generated (the code to do this is already in the function -- don't alter it) Here is an example output for stat_report(cell_width=12): Mean Diff | T-value 1 P-value | 28.972 | 7.465 0.016 | | 24.3932.175 | 0.019 11.488 | 6.278 10.232 11.55 3.831 | 0.0471 1 217.179 10.592 0.103 | 1 172.863 5.717 0.205 1 - All numbers need to be rounded using the round() function to 3 places (e.g., round(321.234323, 3)). This means that numbers can have anywhere from 1 to 3 significant digits. This is different than what would happen if you used f-strings and specified .3f (that would always* lead to 3 significant digits). - The function is called with a cell_width argument. This is the total width of each cell. The title, dashes, and numbers, all have to be centered within this number of characters. Eg., here is the output for stat_report(cell_width=9): Mean Diff| T-value | P-value |-------- ---- | 20.329 5.802 | 0.128 | | 9.514 14.826 0.037 | 90.281 2.63 0.219 | 76.022 21.487 0.145 1226.181 3.374 10.16 249.835 4.885 | 0.192 | - If this function is called with a width less than 9, Just use 9. - The number of dashes is static and dictated by the length of the column heading, not the numbers underneath. def stat_report(cell_width: int): #*** The code below is given as part of the assignemnt. **** You are not allowed to alter this code in any way. # *** It generates teh data you need to report in your table. results = [] for i in range(6): results.append( {'mean_diff': random.randint(0, 500) * random.random(). 't_value': random.randint(1, 30) * random.random(). 'p_value: random.random()/4) ) # put your code here... return None from pprint import pprint from copy import deepcopy import string import random from MLK_dream_speech_1963 import speech # These are 'global' variable that are automatically available to all functions. # DO NOT ALTER ANY GLOBAL VARIABLE IN ANY OF YOUR CODE!! # *weese raw_questions BRE how old are you (18-99)? how often do you drive while talking on the phone (O=Never..5=Sometimes.10=Often)? what kind of phone operating system do you use (ios, android, linux, windows)? how often do you drive while listening to music (O=Never..5=Sometimes..10=Often)? are you left handed or right handed (left, right, neither)? in what kind of traffic would you _not_drive while using your phone? Which of the following types of phones have you _owned_in the past (ios, android, linux, windows)? 11 run_survey This function will be called with a string similar to the one in the global variable 'raw_questions' defined above. Your function will need to iterate over the questions in raw_questions and pose each to the participant (all words in each question should be converted to title case (unless the word is surrounded by "_"). If any word in a question is surrounded by "-", then you are to remove those characters and uppercase that word. No question will every have more than one word surrounded by "_"! (note: I strongly recommend implementing this requirement at the end, after everything else is working). After the participant enters their response, you are to store each response in a list. Before you store the response in the list: - Remove leading and trailing spaces. - Remove any commas or periods. - Convert any double spaces to single spaces. - Lowercase the string. If the response is a number (i.e., only contains digits), you are to store the response as an integer, otherwise, store it as a string. Your function returns a tuple containing the responses. There is no error checking in this function...store whatever the user enters -- even if they enter nothing. E.g.: How Old Are You (18-99)? 50 How often Do You Drive While Talking On The Phone (O=Never..5=Sometimes..10=Often)? 5 What kind of Phone Operating System Do You Use (los, Android, Linux, Windows)? Android How often Do You Drive While Listening To Music (O=Never..5=Sometimes..10=Often)? 8 Are You Left Handed Or Right Handed (Left, Right, Nether)? right In What Kind Of Traffic Would You NOT Drive While Using Your Phone? If there were lots of cars, and I needed to focus. Which Of The Following Types Of Phones Have You OWNED In The Past (los, Android, Linux, Windows)? los, windows In this case, your function would return this tuple: (50, 5, android, 8, 'right', 'if there were lots of cars and I needed to focus', 'los windows') def run_survey(question text: str) -> tuple: return None text_graph) This function takes a dictionary as input. You can assume that the keys will be strings and that the values will be numbers. You are going to create a horizontal text-based graph that plots each number as a series of symbols. For example, if the input is this dict: (TOS": 3, 'TNG': 7, "DS9": 7, "Voyager': 7, 'Enterprise": 4, "Discovery': 3, "Picard": 1} you would print this graph: Star Trek TV Series Comparison ======== TOS TNG DS9 Voyager |*** Enterprise **** Discovery |*** Picard 1" Number of Aired Episodes At it's core, the goal is to print each key and then print enough symbols to represent the value. However, in order to recreate this graph, you will have to 1: - print the title and a number of equal signs below it of the same length - figure out the maximum key length - left adjust the strings using a width of the maximum key length plus 1 - print the a series of dashes for the x-axis that is the length of the maximum value and is spaced over to a distance of 1 plus the maximum key length. - print the x-axis label directly beneath th x-axis dashes. You can't be sure what the keys will be, so you can't just hard code the left adjust to 1 + the length of "Enterprise". You have to figure out what is the maximum key length by inspecting the input data structure. note: this function doesn't return anything, it prints the graph. def text_graph(data: dict, title: str, xaxis label: str, symbol: str = ""): return None BE catalog.speech_words() At the top of this file the variable 'speech' has been imported and is a very large string containing Martin Luther King's 1963 'I Have a Dream' speech. Assume a file is already created called MLK dream speech 1963.py. Your function will be called with speech as the argument, e.g. catalog_speech_words(get_speech_words(speech)). Your function should output a dictionary whose keys are the lowercased words from this speech, and whose values are the number of times each word is found in the speech. E.g.: ('five': 1, 'score': 1, 'years': 5, 'ago': 1,...). For this function, a word is defined as being separated from other text by a space. Before counting the words in this speech, you will need to - remove all punctuation Note: Hyphenated words like "snow-capped" will be treated as 1 word after you remove punctuation. That is ok. - replace all newline characters with spaces - replace all triple and double spaces with single spaces Note: This should go without saying, given that you are only allowed to use techniques we have already covered, but for this assignment you are especially not allowed to use the Python's Counter class. def catalog_speech_words(speech_text: str) -> dict: return None stat_report() This function produces a table. Each row contains a mean difference, a t-value, and a p-value. These numbers are randomly generated (the code to do this is already in the function -- don't alter it) Here is an example output for stat_report(cell_width=12): Mean Diff | T-value 1 P-value | 28.972 | 7.465 0.016 | | 24.3932.175 | 0.019 11.488 | 6.278 10.232 11.55 3.831 | 0.0471 1 217.179 10.592 0.103 | 1 172.863 5.717 0.205 1 - All numbers need to be rounded using the round() function to 3 places (e.g., round(321.234323, 3)). This means that numbers can have anywhere from 1 to 3 significant digits. This is different than what would happen if you used f-strings and specified .3f (that would always* lead to 3 significant digits). - The function is called with a cell_width argument. This is the total width of each cell. The title, dashes, and numbers, all have to be centered within this number of characters. Eg., here is the output for stat_report(cell_width=9): Mean Diff| T-value | P-value |-------- ---- | 20.329 5.802 | 0.128 | | 9.514 14.826 0.037 | 90.281 2.63 0.219 | 76.022 21.487 0.145 1226.181 3.374 10.16 249.835 4.885 | 0.192 | - If this function is called with a width less than 9, Just use 9. - The number of dashes is static and dictated by the length of the column heading, not the numbers underneath. def stat_report(cell_width: int): #*** The code below is given as part of the assignemnt. **** You are not allowed to alter this code in any way. # *** It generates teh data you need to report in your table. results = [] for i in range(6): results.append( {'mean_diff': random.randint(0, 500) * random.random(). 't_value': random.randint(1, 30) * random.random(). 'p_value: random.random()/4) ) # put your code here... return None