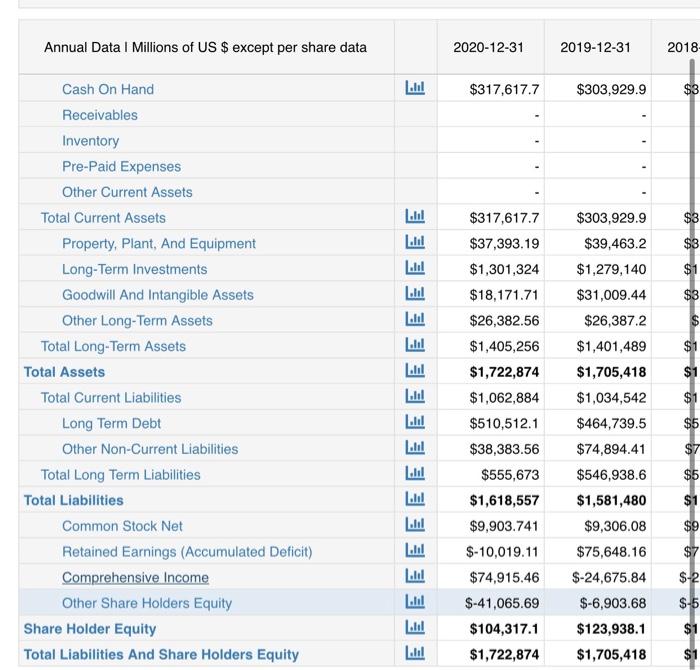
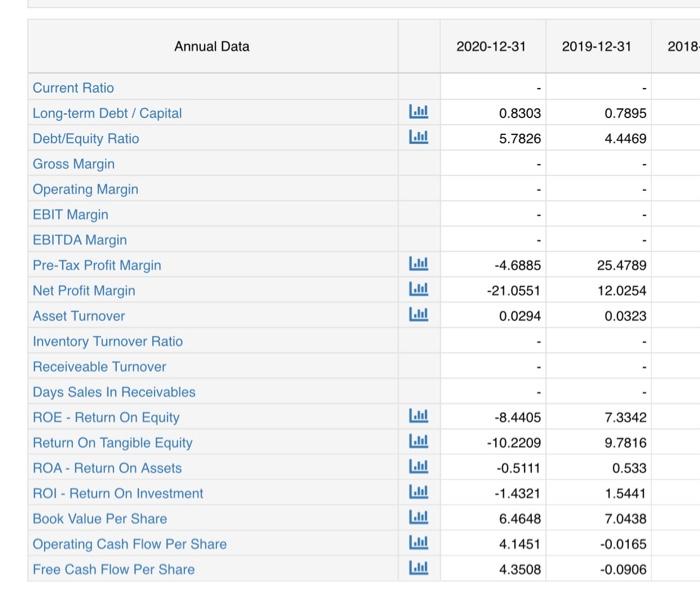
From the Income statement (1st picture) and Balance sheet (2nd picture), how all of the ratios where calculate, show calculations and explain what each lf them means
Annual Data 1 Millions of US $ except per share data 2020-12-31 2019-12-31 EEE $66,283.1 $15,703.2 $50,579.9 $79,218.72 $24,082.24 $55,136.48 E $23,587.35 $25,435.2 $42,500.41 $23,782.69 $52,878.56 $26,340.16 Revenue Cost Of Goods Sold Gross Profit Research And Development Expenses SG&A Expenses Other Operating Income Or Expenses Operating Expenses Operating Income Total Non-Operating Income/Expense Pre-Tax Income Income Taxes Income After Taxes Other Income Income From Continuous Operations Income From Discontinued Operations Net Income EBITDA EBIT Basic Shares Outstanding Shares Outstanding Basic EPS EPS - Earnings Per Share EEEEEE $-26,042.16 $-2,371.415 $6,433.434 $-8,804.849 $-12,292 $14,048.16 $4,958.24 $9,089.92 $-8,804.849 $9,089.92 ! $-10,649.66 $6,630.4 EEEE 17,316 17,316 $-0.61 $-0.61 17,310 17,348 $0.38 $0.38 Annual Data 1 Millions of US $ except per share data 2020-12-31 2019-12-31 2018 $317,617.7 $303,929.9 $3 $317,617.7 $3 $3 EE EEE $1 $3 Cash On Hand Receivables Inventory Pre-Paid Expenses Other Current Assets Total Current Assets Property, Plant, And Equipment Long-Term Investments Goodwill And Intangible Assets Other Long-Term Assets Total Long-Term Assets Total Assets Total Current Liabilities Long Term Debt Other Non-Current Liabilities Total Long Term Liabilities Total Liabilities Common Stock Net Retained Earnings (Accumulated Deficit) Comprehensive Income Other Share Holders Equity Share Holder Equity Total Liabilities And Share Holders Equity $1 $5 $37,393.19 $1,301,324 $18,171.71 $26,382.56 $1,405,256 $1,722,874 $1,062,884 $510,512.1 $38,383.56 $555,673 $1,618,557 $9.903.741 $-10,019.11 $74,915.46 $-41,065.69 $104,317.1 $1,722,874 $303,929.9 $39,463.2 $1,279,140 $31,009.44 $26,387.2 $1,401,489 $1,705,418 $1,034,542 $464,739.5 $74,894.41 $546,938.6 $1,581,480 $9,306.08 $75,648.16 $-24,675.84 $-6,903.68 $123,938.1 $1,705,418 $7 |il $5 $1 $9 $7 $-2 $-5 $1 Annual Data 2020-12-31 2019-12-31 2018 0.8303 0.7895 EE 5.7826 4.4469 -4.6885 -21.0551 0.0294 25.4789 12.0254 0.0323 Current Ratio Long-term Debt / Capital Debt/Equity Ratio Gross Margin Operating Margin EBIT Margin EBITDA Margin Pre-Tax Profit Margin Net Profit Margin Asset Turnover Inventory Turnover Ratio Receiveable Turnover Days Sales In Receivables ROE - Return On Equity Return On Tangible Equity ROA - Return On Assets ROI - Return On Investment Book Value Per Share Operating Cash Flow Per Share Free Cash Flow Per Share 7.3342 EEE -8.4405 -10.2209 -0.5111 -1.4321 6.4648 4.1451 4.3508 9.7816 0.533 1.5441 7.0438 -0.0165 -0.0906 EE Annual Data 1 Millions of US $ except per share data 2020-12-31 2019-12-31 EEE $66,283.1 $15,703.2 $50,579.9 $79,218.72 $24,082.24 $55,136.48 E $23,587.35 $25,435.2 $42,500.41 $23,782.69 $52,878.56 $26,340.16 Revenue Cost Of Goods Sold Gross Profit Research And Development Expenses SG&A Expenses Other Operating Income Or Expenses Operating Expenses Operating Income Total Non-Operating Income/Expense Pre-Tax Income Income Taxes Income After Taxes Other Income Income From Continuous Operations Income From Discontinued Operations Net Income EBITDA EBIT Basic Shares Outstanding Shares Outstanding Basic EPS EPS - Earnings Per Share EEEEEE $-26,042.16 $-2,371.415 $6,433.434 $-8,804.849 $-12,292 $14,048.16 $4,958.24 $9,089.92 $-8,804.849 $9,089.92 ! $-10,649.66 $6,630.4 EEEE 17,316 17,316 $-0.61 $-0.61 17,310 17,348 $0.38 $0.38 Annual Data 1 Millions of US $ except per share data 2020-12-31 2019-12-31 2018 $317,617.7 $303,929.9 $3 $317,617.7 $3 $3 EE EEE $1 $3 Cash On Hand Receivables Inventory Pre-Paid Expenses Other Current Assets Total Current Assets Property, Plant, And Equipment Long-Term Investments Goodwill And Intangible Assets Other Long-Term Assets Total Long-Term Assets Total Assets Total Current Liabilities Long Term Debt Other Non-Current Liabilities Total Long Term Liabilities Total Liabilities Common Stock Net Retained Earnings (Accumulated Deficit) Comprehensive Income Other Share Holders Equity Share Holder Equity Total Liabilities And Share Holders Equity $1 $5 $37,393.19 $1,301,324 $18,171.71 $26,382.56 $1,405,256 $1,722,874 $1,062,884 $510,512.1 $38,383.56 $555,673 $1,618,557 $9.903.741 $-10,019.11 $74,915.46 $-41,065.69 $104,317.1 $1,722,874 $303,929.9 $39,463.2 $1,279,140 $31,009.44 $26,387.2 $1,401,489 $1,705,418 $1,034,542 $464,739.5 $74,894.41 $546,938.6 $1,581,480 $9,306.08 $75,648.16 $-24,675.84 $-6,903.68 $123,938.1 $1,705,418 $7 |il $5 $1 $9 $7 $-2 $-5 $1 Annual Data 2020-12-31 2019-12-31 2018 0.8303 0.7895 EE 5.7826 4.4469 -4.6885 -21.0551 0.0294 25.4789 12.0254 0.0323 Current Ratio Long-term Debt / Capital Debt/Equity Ratio Gross Margin Operating Margin EBIT Margin EBITDA Margin Pre-Tax Profit Margin Net Profit Margin Asset Turnover Inventory Turnover Ratio Receiveable Turnover Days Sales In Receivables ROE - Return On Equity Return On Tangible Equity ROA - Return On Assets ROI - Return On Investment Book Value Per Share Operating Cash Flow Per Share Free Cash Flow Per Share 7.3342 EEE -8.4405 -10.2209 -0.5111 -1.4321 6.4648 4.1451 4.3508 9.7816 0.533 1.5441 7.0438 -0.0165 -0.0906 EE