G h docs.google.com + G 3.4 Long-Ru.. G 3.5 Equilibrium.. G 3.7 Long-Run... G 3.8.1- Fiscal. G Macro Topic... Dashboard G Macro Topic... G Macro
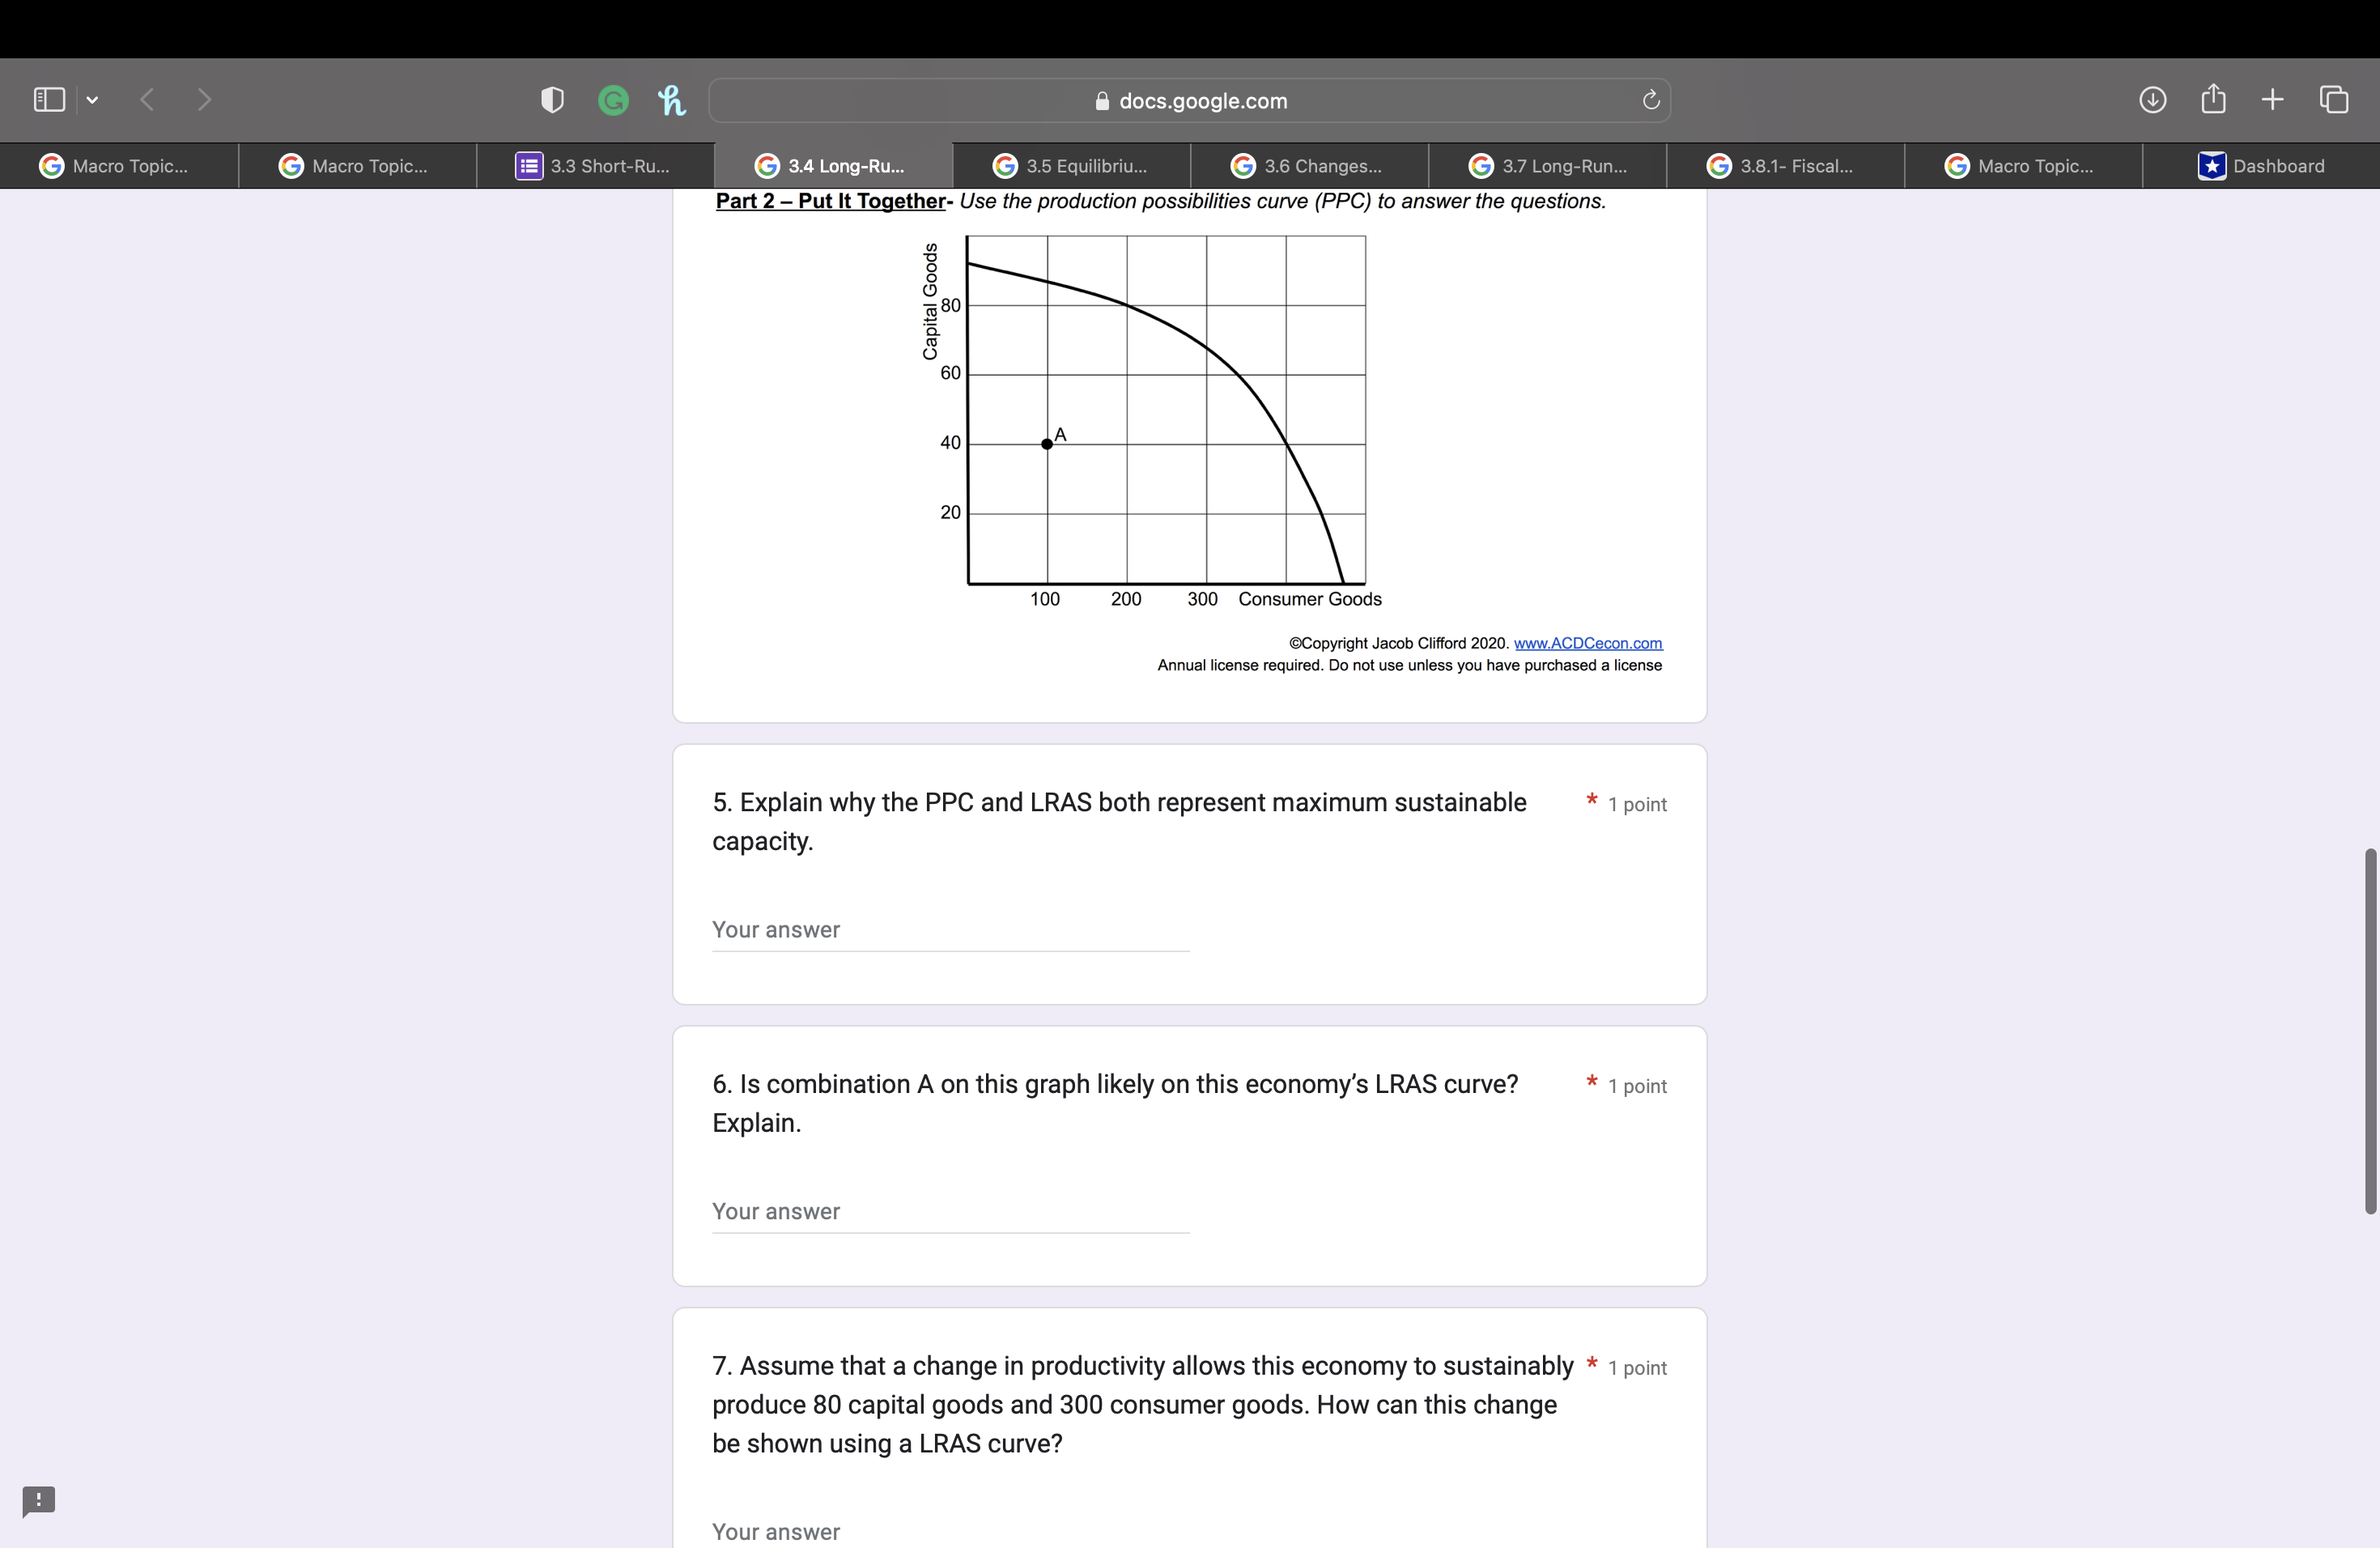
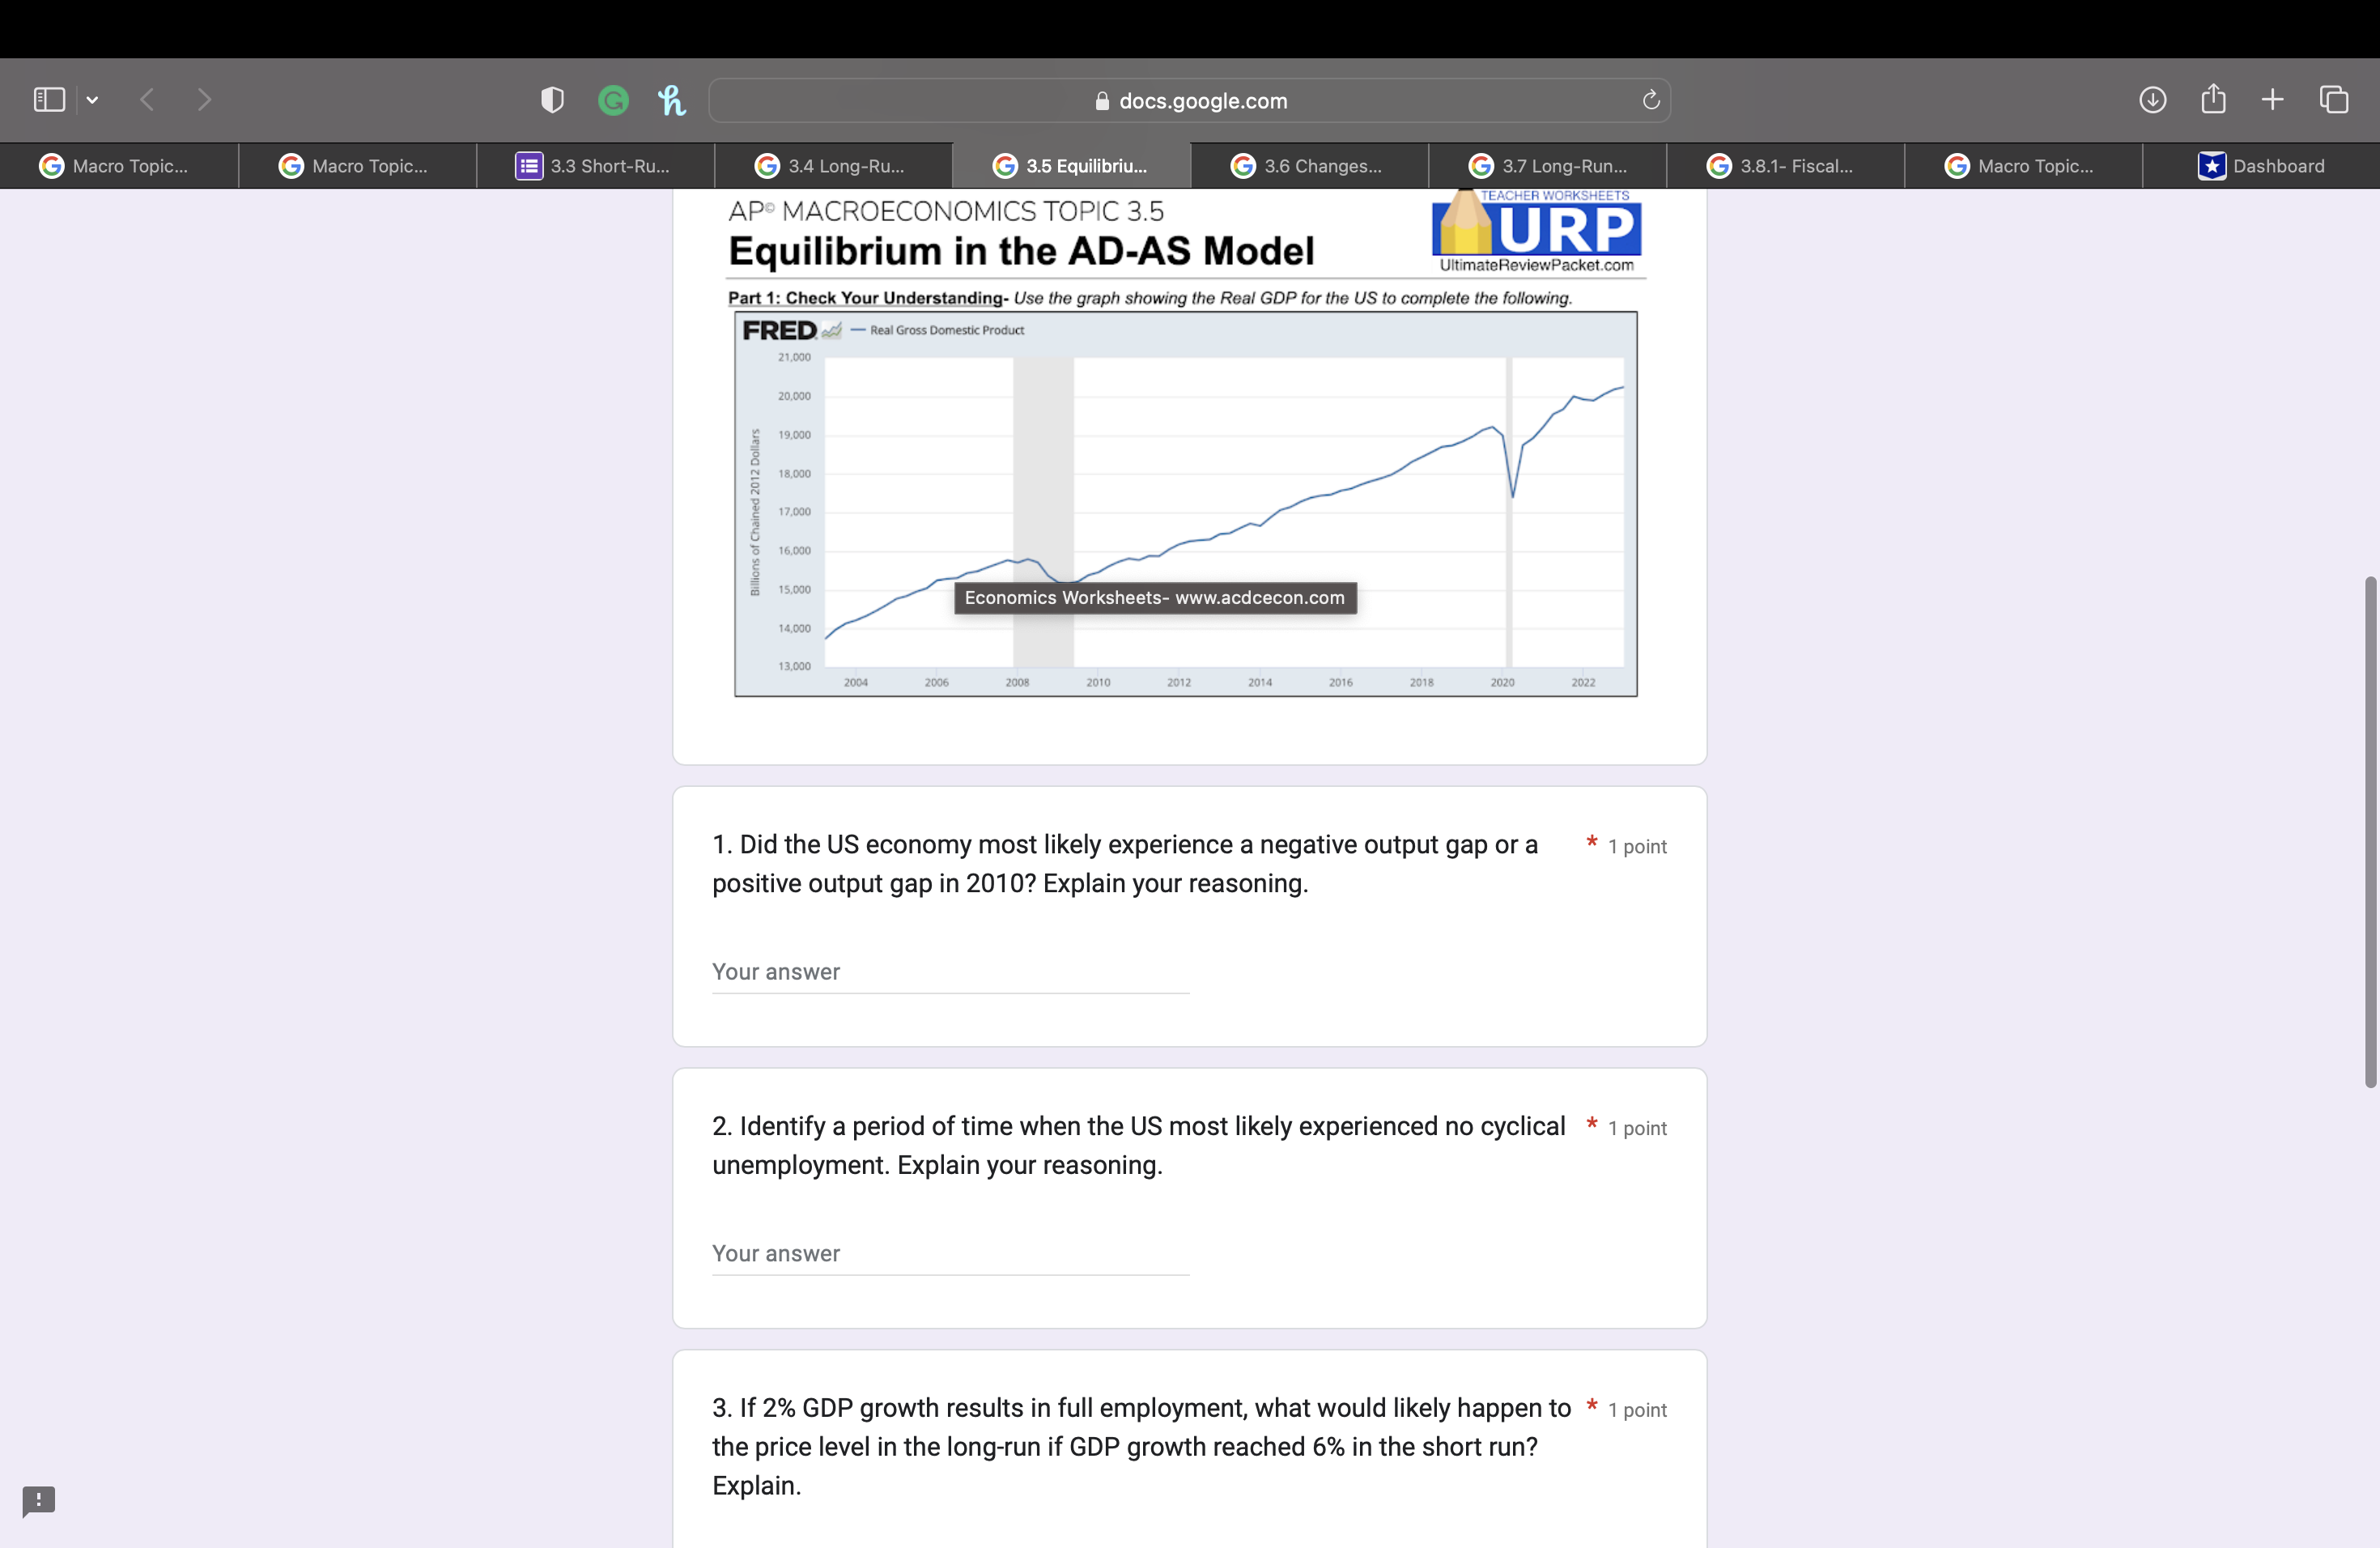
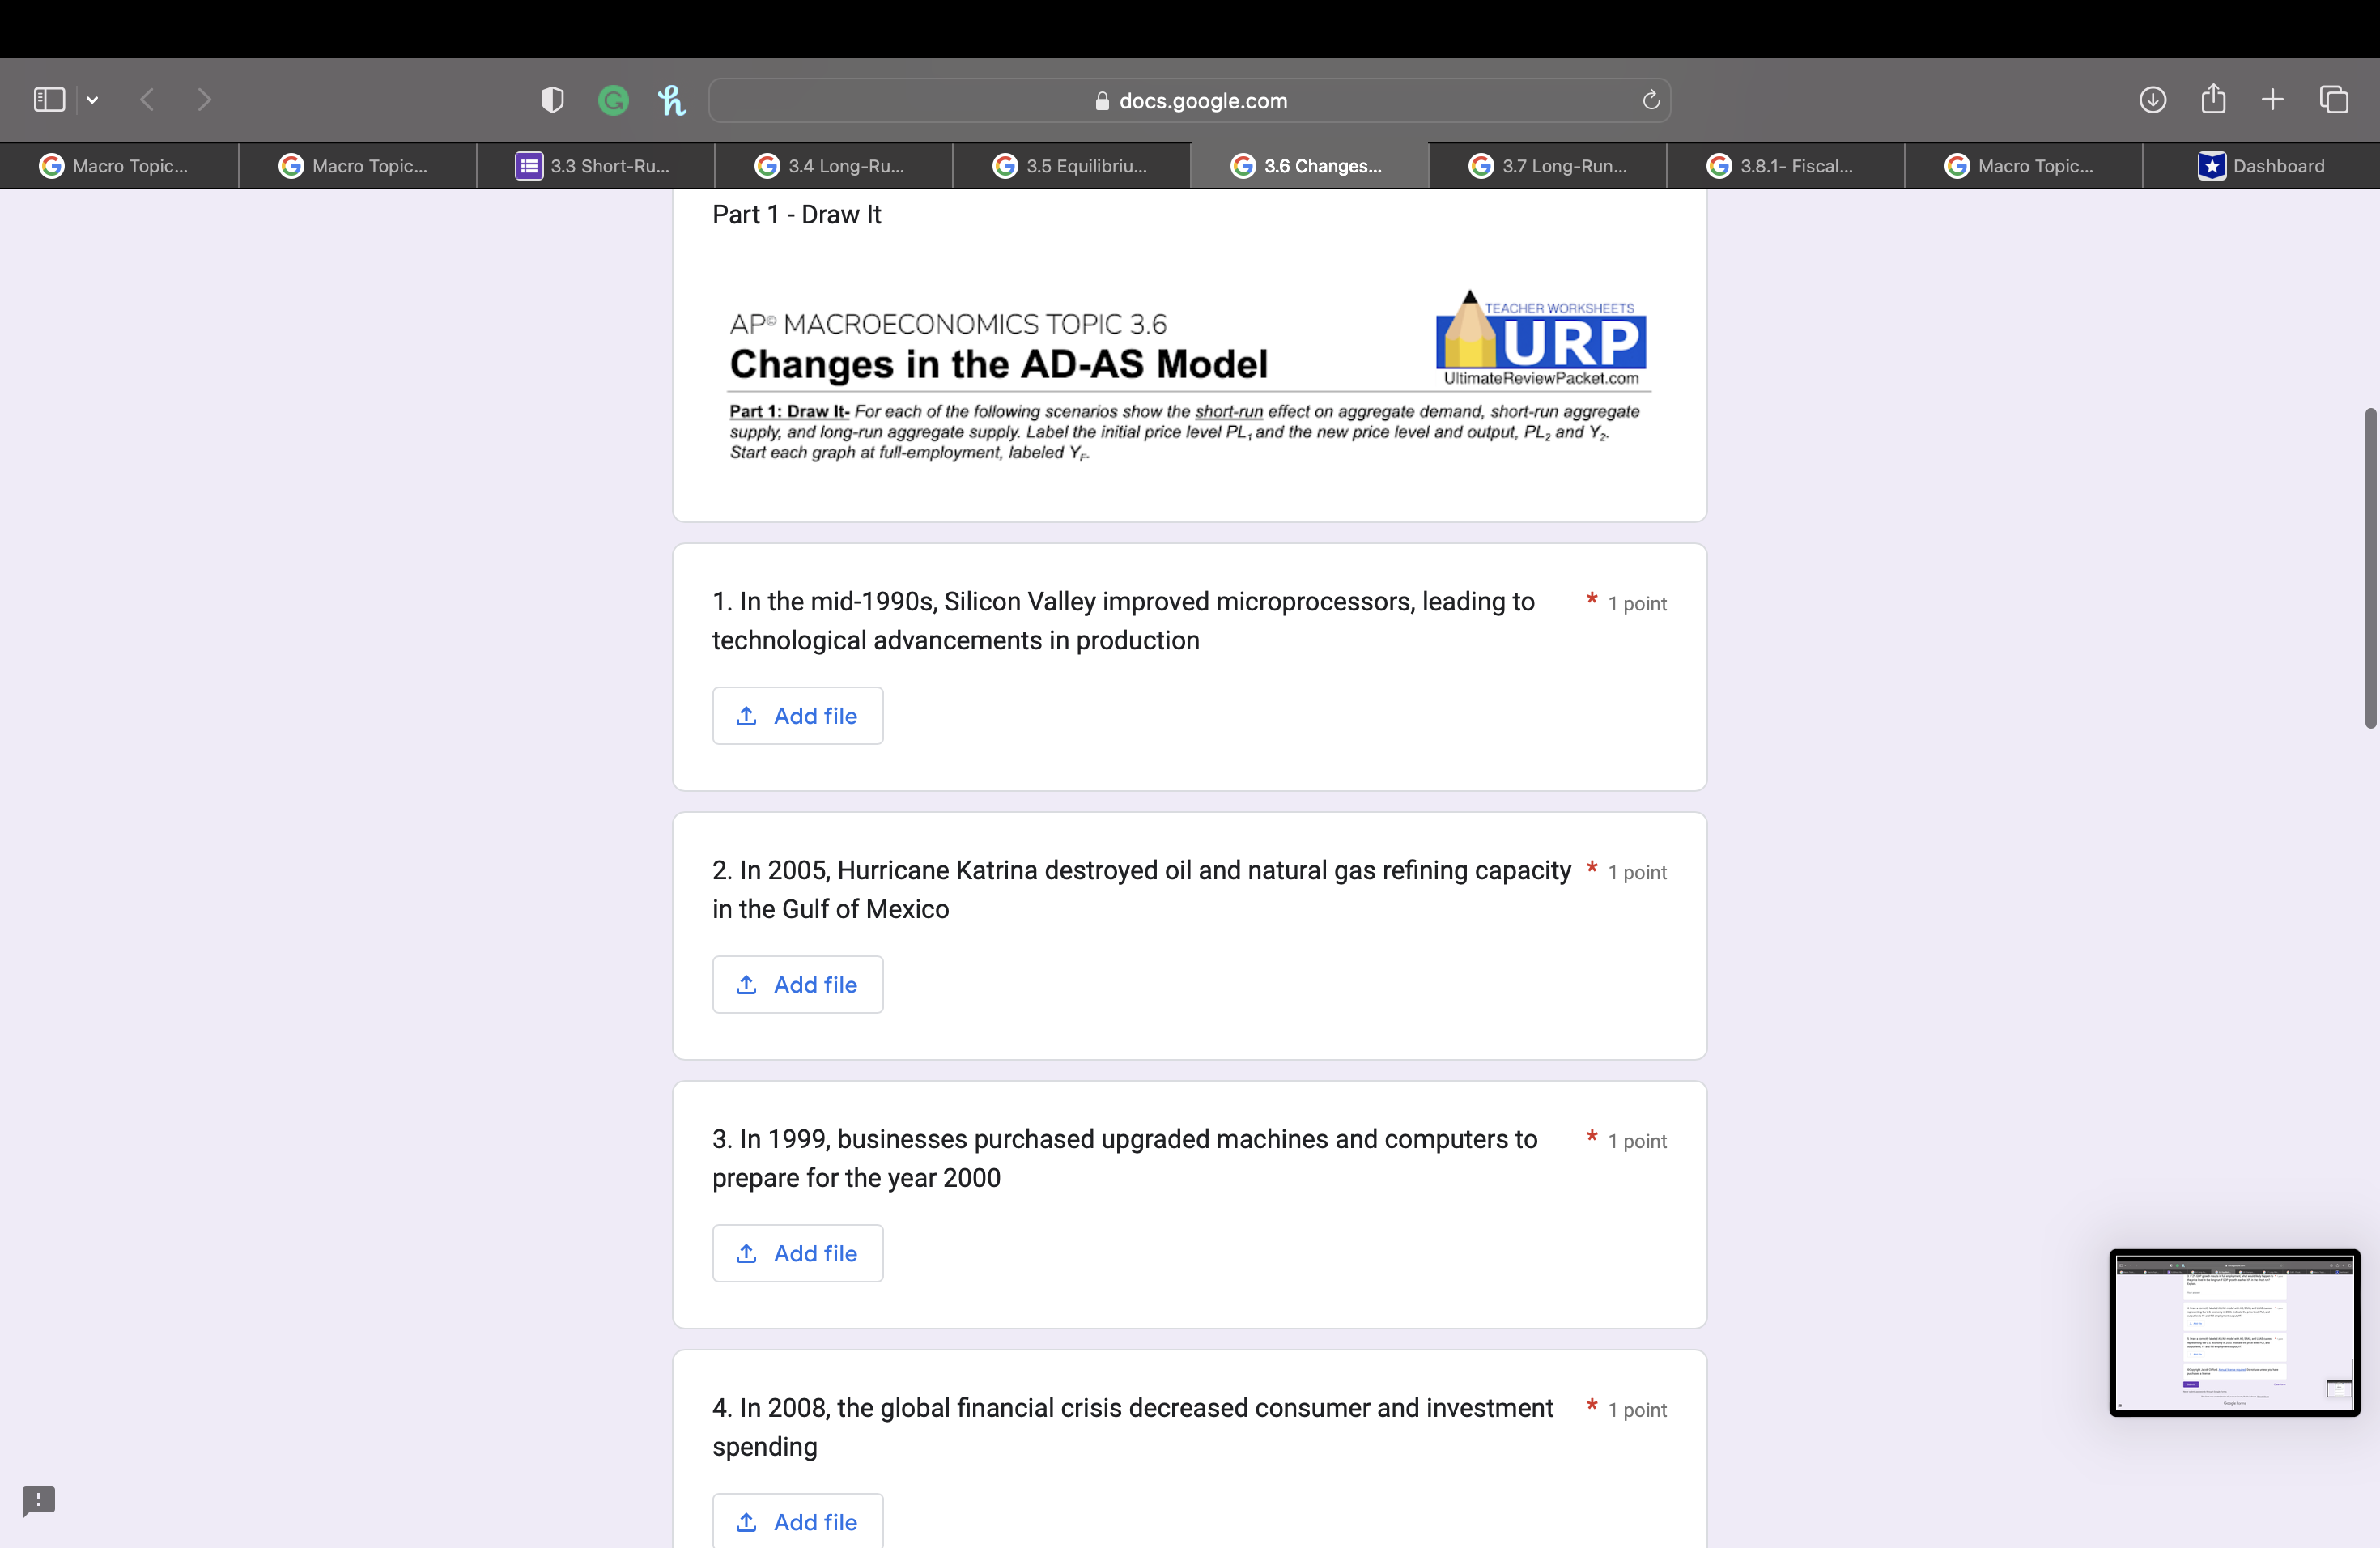
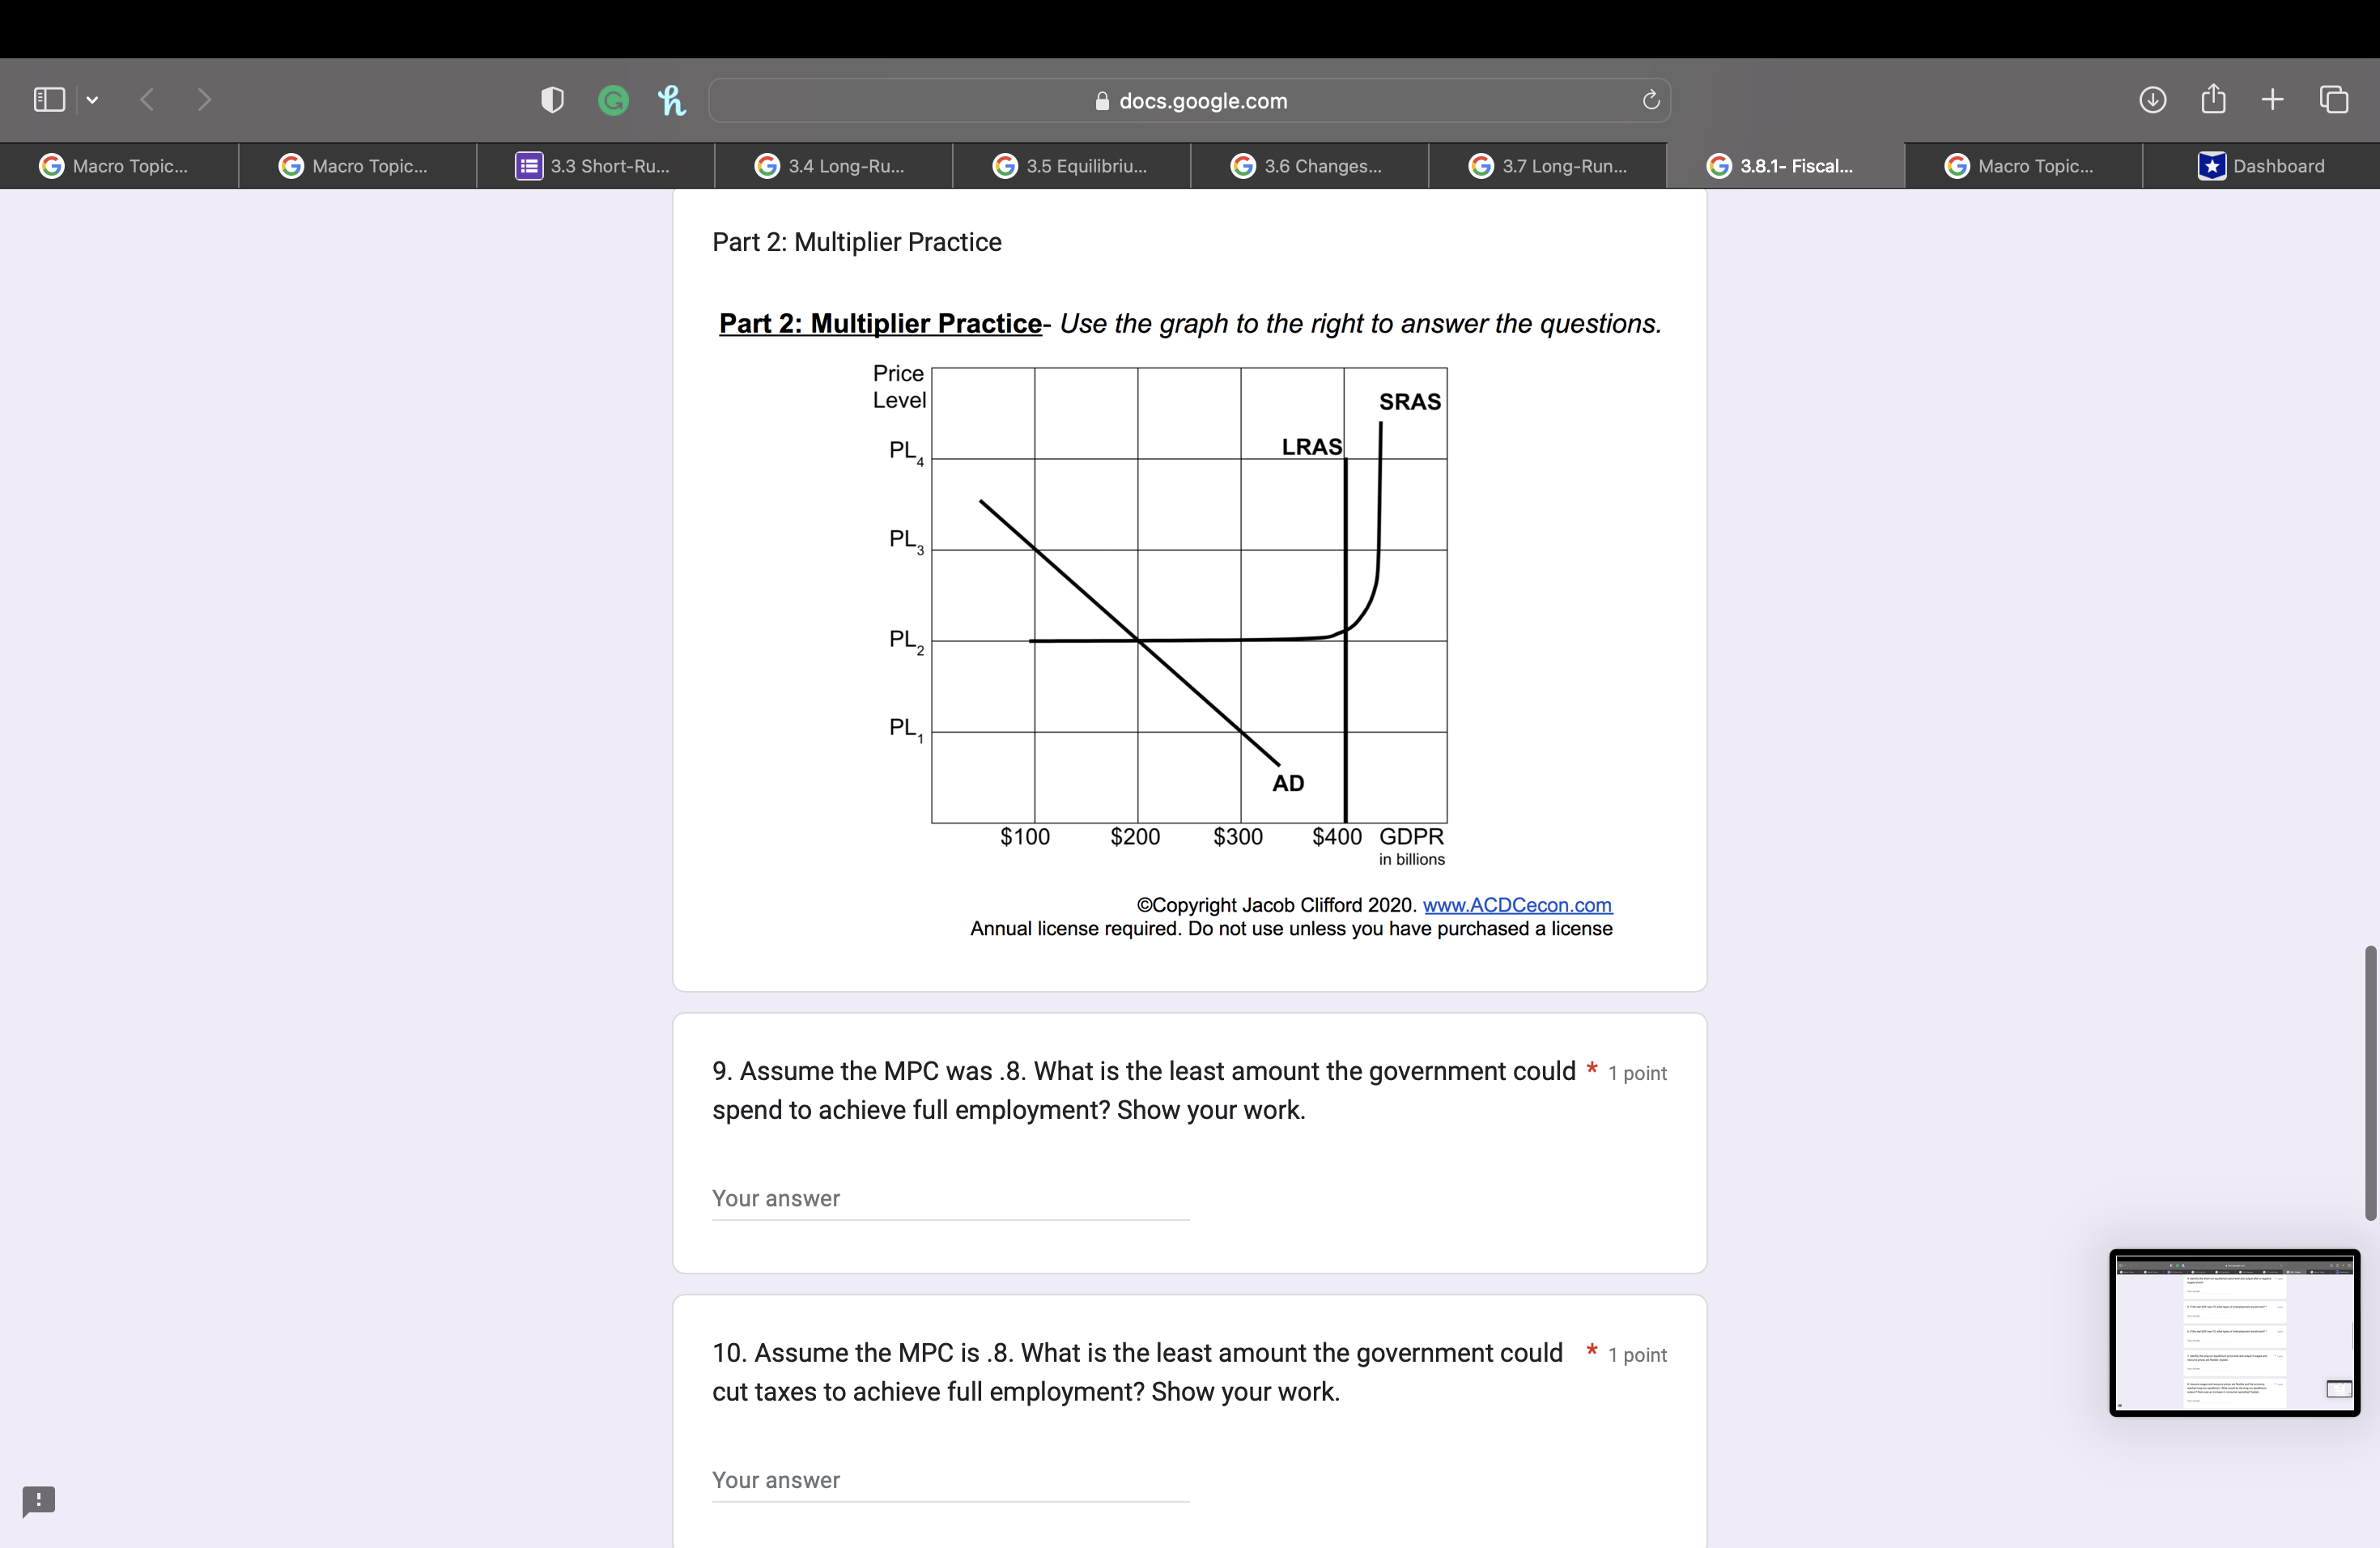
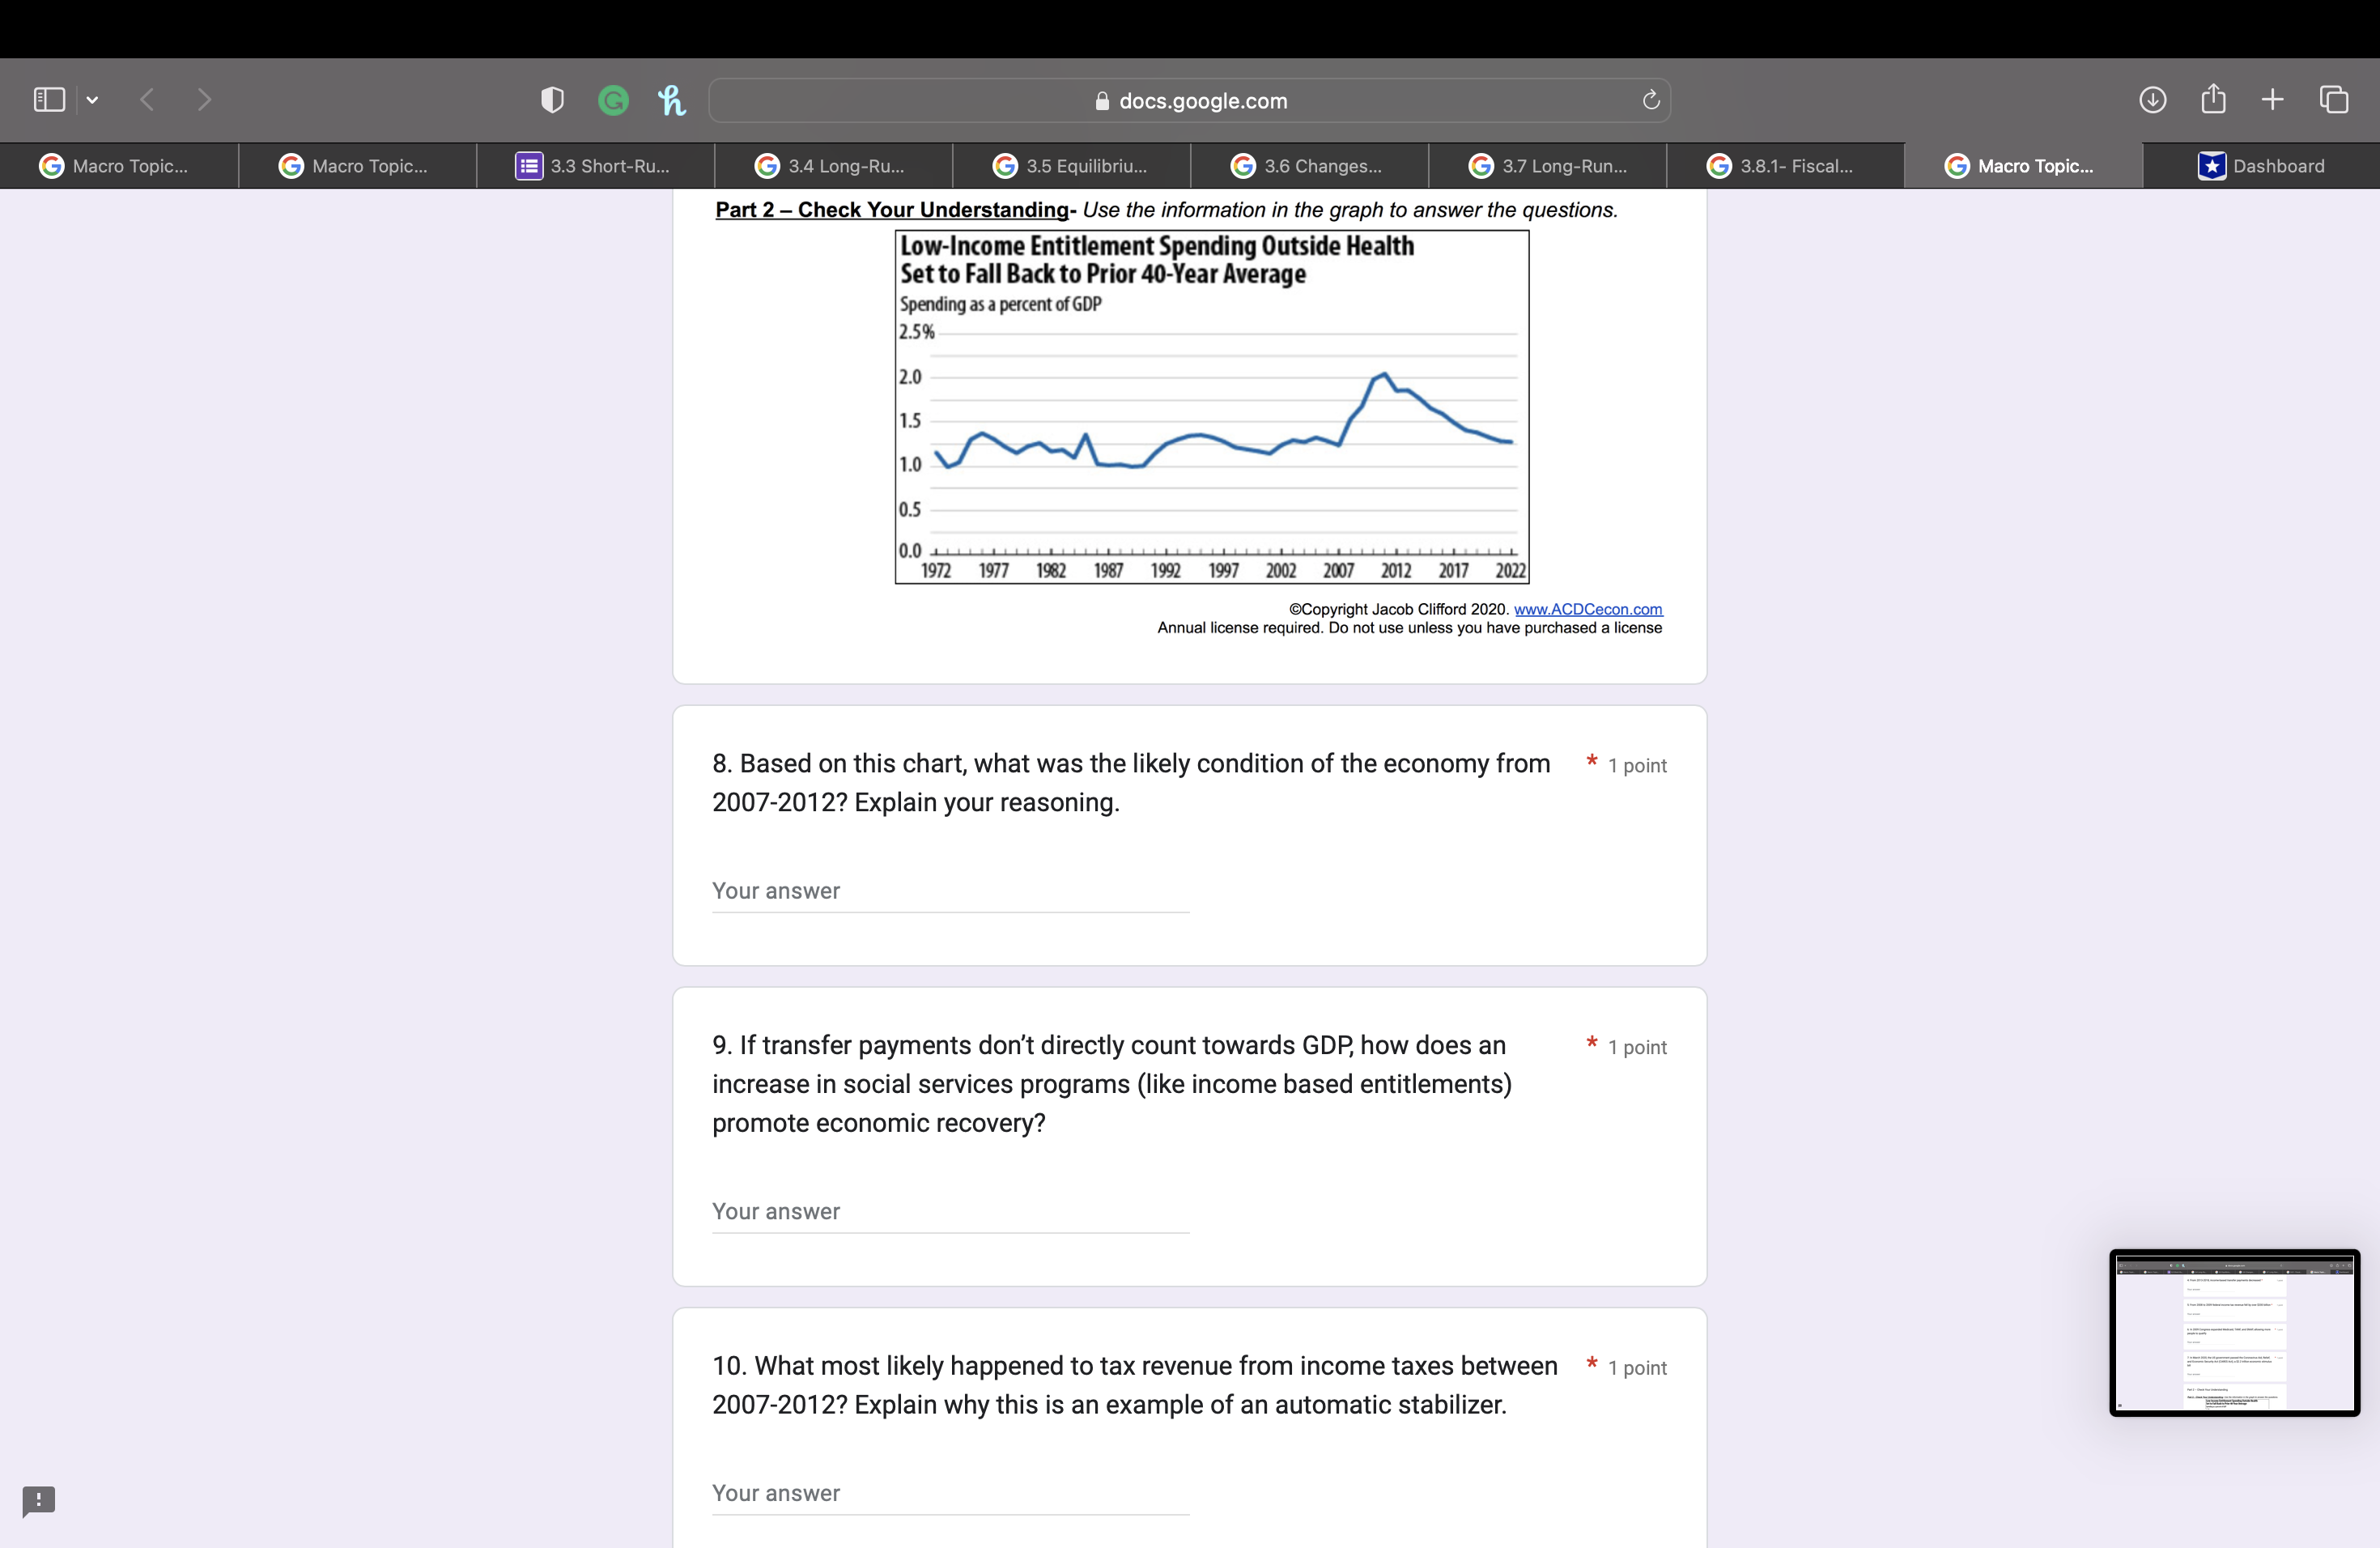
G h docs.google.com + G 3.4 Long-Ru.. G 3.5 Equilibrium.. G 3.7 Long-Run... G 3.8.1- Fiscal. G Macro Topic... Dashboard G Macro Topic... G Macro Topic... |3.3 Short-Ru.. G 3.6 Changes... 1. Identify the three reasons why the aggregate demand curve is downward * 1 point sloping. Your answer 2. Identify the shifters/determinants of aggregate demand. * 1 point Your answer Part 2 - Practice Part 2: Practice- For each scenario, identify the shifter/determinants of aggregate demand and indicate if the aggregate demand will most likely increase (1), decrease (1), or not change (NC) in the short run. 3. Congress cuts personal income taxes by $20 million. * 1 point Your answer 4. Interest rates increase causing a decrease in capital stock. * 1 point Your answerG h docs.google.com + G 3.4 Long-Ru.. G 3.5 Equilibrium.. G 3.7 Long-Run... G 3.8.1- Fiscal. G Macro Topic... Dashboard G Macro Topic... G Macro Topic... |3.3 Short-Ru.. G 3.6 Changes... 1. Identify the three reasons why the aggregate demand curve is downward * 1 point sloping. Your answer 2. Identify the shifters/determinants of aggregate demand. * 1 point Your answer Part 2 - Practice Part 2: Practice- For each scenario, identify the shifter/determinants of aggregate demand and indicate if the aggregate demand will most likely increase (1), decrease (1), or not change (NC) in the short run. 3. Congress cuts personal income taxes by $20 million. * 1 point Your answer 4. Interest rates increase causing a decrease in capital stock. * 1 point Your answerG h docs.google.com 3 C + |3.3 Short-Ru.. G 3.4 Long-Ru.. G 3.5 Equilibrium.. G 3.6 Changes... G 3.7 Long-Run... G 3.8.1- Fiscal. G Macro Topic... Dashboard G Macro Topic... G Macro Topic... 5. Consumer confidence declines and people fear a recession. * 1 point Your answer 6. Incomes increase for US trading partners Canada and China. * 1 point Your answer 7. The price level increases by 5%. * 1 point Your answer 8. Defense spending is increased due to military conflicts abroad. * 1 point Your answer 9. The government raises taxes and cuts spending in an attempt to balance * 1 point its budget. Your answer 10. Businesses expect growth for most US industries. * 1 pointG h docs.google.com + G Macro Topic... G Macro Topic... |3.3 Short-Ru.. G 3.4 Long-Ru.. G 3.5 Equilibrium.. G 3.6 Changes.. G 3.7 Long-Run.. G 3.8.1- Fiscal. G Macro Topic... Dashboard 11. Interest rates decrease from 5% to 2%. * 1 point Your answer 12. Stock market collapses causing the loss of millions of dollars of assets. * 1 point Your answer Part 3 - Draw It Part 3: Draw It- Draw the effect on aggregate demand for the United States as a result of each scenario. Label the axes and the aggregate demand curve and show the change using an arrow. 13. Government spending decreases 1 point L Add file 14. Canadians buy more American-made cars * 1 point L Add file 15. Higher interest rates * 1 point Add fileG h docs.google.com + G Macro Topic... G Macro Topic... |3.3 Short-Ru.. G 3.4 Long-Ru.. G 3.5 Equilibrium.. G 3.6 Changes... G 3.7 Long-Run.. G 3.8.1- Fiscal. G Macro Topic... Dashboard Part 4 - Stretch Your Thinking Part 4: Stretch Your Thinking- Complete the following. 16. Explain how a small initial decrease in consumer spending can lead to a * 1 point widespread economic downturn. Your answer 17. In Unit 1 you learned that the substitution effect explains why a market * 1 point demand is downward sloping. Explain why the substitution effect doesn't apply to aggregate demand. Your answer Copyright Jacob Clifford. Annual license required. Do not use unless you have purchased a license Submit Clear form Never submit passwords through Google Forms. This form was created inside of Loudoun County Public Schools. Report Abuse Google FormsC + G h docs.google.com G 3.6 Changes... G Macro Topic... Dashboard G Macro Topic... 3.3 Short-Ru.. G 3.4 Long-Ru.. G 3.5 Equilibrium.. G 3.7 Long-Run.. G 3.8.1- Fiscal.. G Macro Topic... 1. What is the MPC, MPS, and Multiplier for scenario #1? * 1 point Your answer 2. What is the MPS, Multiplier, and Max Change in Spending for scenario * 1 point #2? Your answer 3. What is the MPC, Multiplier, and Max Change in Spending for scenario * 1 point #3? Your answer 4. What is the Change in Consumption, MPC, and MPS for scenario #4? * 1 point Your answer 5. What is the MPC, MPS, and Multiplier for scenario #5? * 1 point Your answer Part 2: Making Connections G docs.google.com C + G Macro Topic... G Macro Topic... 3.3 Short-Ru.. G 3.4 Long-Ru.. G 3.5 Equilibrium.. G 3.6 Changes... G 3.7 Long-Run.. G 3.8.1- Fiscal.. G Macro Topic... Dashboard Part 2: Making Connections- In 2009, the US Federal government cut taxes by approximately $300 billion, increased government spending by approximately $300 billion, and increased transfer payments by approximately $200 billion. Answer the following questions assuming that the marginal propensity to consume was 0.75 6. What was the maximum change in GDP from the government spending? * 1 point Show your work Your answer 7. What was the maximum change in GDP from the tax cut? Show your * 1 point work. Your answer 8. What was the maximum change in GDP from the government transfers? * 1 point Show your work. Your answer 9. Assume instead that American consumers, fearing an economic * 1 point collapse, increased their marginal propensity to save to 0.5. Would this increase, decrease, or not change the effectiveness of the stimulus package? Explain. Your answerG C + h docs.google.com G Macro Topic... Dashboard G Macro Topic... G Macro Topic... 3.3 Short-Ru.. G 3.4 Long-Ru.. G 3.5 Equilibrium.. G 3.6 Changes... G 3.7 Long-Run.. G 3.8.1- Fiscal.. 10. Assume the marginal propensity to save was 0.5 instead of 0.75. * 1 point Calculate the maximum change in GDP from the entire stimulus package? Show your work. Your answer Part 3: More Practice Part 3: More Practice- Assume that in the year 2025 the US economy is in a recession that would require a $1 Trillion increase in total spending to get back to full employment output. Answer the following questions assuming that the marginal propensity to consume is 0.8. Copyright Jacob Clifford 2020. www.ACDCecon.com Annual license required. Do not use unless you have purchased a license 11. Identify the least amount the government could spend to get the * 1 point economy back to full employment. Show your work. Your answer 12. Identify the dollar amount of a tax cut to bring the economy back to full * 1 point employment. Show your work. Your answer Part 4: Stretch Your ThinkingEm)s @ Macro Topic 3 & docs.google.com @ Macro Topic... 3 Short-Ru @ 3.4 Long-Ru, @ 35 Equilibriu @ 36h 3.7 Long-Run S (X employment. Show your work. Your answer Part 4: Stretch Your Thinking Part 4: Stretch Your Thinking- Answer the question. 13. Suppose that Bob earns $20,000 a year and that Jimena earns * 1 point $200,000 a year and that both earned a 10% increase in their disposable income. Who do you think is likely to have the higher MPC? Explain your reasoning. Your answer Copyright Jacob Clifford. Annual license required. Do not use unless you have purchased a license Never submit passwords through Google Forms. This form was created inside of Loudoun County Public Schools. Report Abuse Google Forms [ A (w (] pashboard Em)s @ Macro Topic @ Macro Topic. 1 3.3 Short-Ru... @ docs.google.com @ 3.4 Long-Ru (RIS @ 3.6 Chan Long-Run 1. Why does an increase in price level cause an increase in the quantity supplied of goods and services in the short run? * 1 point Your answer 2. Explain why wages are more rigid (or sticky) when price level falls rather * 1 point than when price level increases. Your answer Part 2 - Practice Part 2: Practice- For each scenario, identify the shifter/determinants of short-run aggregate supply and indicate if the SRAS will most likely increase (1), decrease (1), or not change (NC). 3. Raw material and resource prices increase significantly in the US. * 1 point Your answer 4. A.l. technology increases productivity and efficiency. * 1 point Your answer 5. There is a significant increase in consumer spending. * 1 point [ A (w (] pashboard G h docs.google.com C + G Macro Topic... G Macro Topic... |3.3 Short-Ru. G 3.4 Long-Ru.. G 3.5 Equilibrium.. G 3.6 Changes... G 3.7 Long-Run.. G 3.8.1- Fiscal.. G Macro Topic... Dashboard 6. Labor productivity increases dramatically due to new training programs. * 1 point Your answer 7. The government raises corporate taxes significantly. * 1 point Your answer 8. Workers expect higher inflation and demand higher wages. * 1 point Your answer 9. The government gives tax credits to businesses. * 1 point Your answer 10. There is a significant decrease in the price of electricity. * 1 point Your answer 11. A trade dispute causes oil prices to more than double. * 1 point Your answer G h docs.google.com C + G Macro Topic... G Macro Topic... |3.3 Short-Ru.. G 3.4 Long-Ru.. G 3.5 Equilibrium.. G 3.6 Changes... G 3.7 Long-Run... G 3.8.1- Fiscal. G Macro Topic... Dashboard Part 3 - Draw It Part 3: Draw It- Draw the effect on short-run aggregate supply for the United States as a result of each scenario. Label the axes and the SRAS curve and show the change using an arrow. 13. Corporate taxes decrease * 1 point 1 Add file 14. Productivity decreases * 1 point 1 Add file 15. Businesses and workers expect significantly higher inflation in the near * 1 point future 1 Add file Part 4 - Stretch Your Thinking Part 4 - Stretch Your Thinking- Consider the quote and answer the question. CARACAS, Venezuela-Giuseppe Cordivani's factory on the outskirts of the capital used to make nearly 300 pairs of women's shoes a day, from pumps to high-heeled dancing shoes that sold nationwide. With hyperinflation biting, he's making just 20 today. The Wall Street Journal, March 2019 G h docs.google.com C + G Macro Topic... G Macro Topic... |3.3 Short-Ru. G 3.4 Long-Ru.. G 3.5 Equilibrium.. G 3.6 Changes... G 3.7 Long-Run.. G 3.8.1- Fiscal. G Macro Topic... Dashboard Part 4 - Stretch Your Thinking Part 4 - Stretch Your Thinking- Consider the quote and answer the question. CARACAS, Venezuela-Giuseppe Cordivani's factory on the outskirts of the capital used to make nearly 300 pairs of women's shoes a day, from pumps to high-heeled dancing shoes that sold nationwide. With hyperinflation biting, he's making just 20 today." -The Wall Street Journal, March 2019 Article Link https://www.wsj.com/articles/hyperinflation-shatters-venezuelan-manufacturing: 11551798001 16. According to the SRAS curve model, a higher price level should cause * 1 point output to increase. Why might hyperinflation in Venezuela actually decrease output? Explain your reasoning. Your answer Copyright Jacob Clifford. Annual license required. Do not use unless you have purchased a license Submit Clear form Never submit passwords through Google Forms. This form was created inside of Loudoun County Public Schools. Report Abuse Google Forms G h docs.google.com C + G Macro Topic... G Macro Topic... |3.3 Short-Ru.. G 3.4 Long-Ru.. G 3.5 Equilibrium.. G 3.6 Changes... G 3.7 Long-Run.. G 3.8.1- Fiscal. G Macro Topic... Dashboard TEACHER WOR AP MACROECONOMICS TOPIC 3.4 Long-Run Aggregate Supply (LRAS) BURP UltimateReviewPacket.com Part 1: Check Your Understanding- Answering the following questions. 1. What happens to the LRAS curve when there is an increase in price level? * 1 point Explain. Your answer 2. What does the LRAS curve imply about the long-run trade-off between * 1 point inflation and unemployment? Explain. Your answer 3. Identify three different reasons the LRAS curve would shift to the right. * 1 point Your answer 4. A change in which of the four components of GDP (consumption, * 1 point investment, government spending, and net exports), would most likely result in the most economic growth? Explain your reasoning. Your answer G h docs.google.com C + G Macro Topic... G Macro Topic... |3.3 Short-Ru.. G 3.4 Long-Ru.. G 3.5 Equilibrium.. G 3.6 Changes... G 3.7 Long-Run... G G Macro Topic... Dashboard Part 2 - Put It Together- Use the production possibilities curve (PPC) to answer the questions. Capital Goods 60 40 A 20 100 200 300 Consumer Goods Copyright Jacob Clifford 2020. www.ACDCecon.com Annual license required. Do not use unless you have purchased a license 5. Explain why the PPC and LRAS both represent maximum sustainable * 1 point capacity. Your answer 6. Is combination A on this graph likely on this economy's LRAS curve? * 1 point Explain. Your answer 7. Assume that a change in productivity allows this economy to sustainably * 1 point produce 80 capital goods and 300 consumer goods. How can this change be shown using a LRAS curve? Your answerEm)s @ Macro Topic ' @ docs.google.com ERSR LT R hanges: PR [ EERREE be shown using a LRAS curve? Your answer Part 3 Stretch Your Thinking Part 3 Stretch Your Thinking- Read the quote below and answer the question. \"Policies to strengthen education and training, to encourage entrepreneurship and innovation, and to promote capital investment, both public and private, could all potentially be of great benefit in improving future living standards in our nation.\" -Janet Yellen, Chairman of the Federal Reserve 8. Pick one of the three policies mentioned in the quote above. Identify * 1 point what that policy would most likely do to the LRAS curve and explain why that policy improves living standards. Your answer Copyright Jacob Clifford. Annual license required. Do not use unless you have purchased a license Never submit passwords through Google Forms. This form was created inside of Loudoun County Public Schools. Report Abuse Google Forms [ A (w (] pashboard G h docs.google.com + G Macro Topic... G Macro Topic... # 3.3 Short-Ru.. G 3.4 Long-Ru.. G 3.5 Equilibrium... G 3.6 Changes... G 3.7 Long-Run.. G 3.8.1- Fiscal.. G Macro Topic... Dashboard AP MACROECONOMICS TOPIC 3.5 EACHER WORKS Equilibrium in the AD-AS Model LURP Ultimate ReviewPacket.com Part 1: Check Your Understanding- Use the graph showing the Real GDP for the US to complete the following. FRED. - Real Gross Domestic Product 21,000 20,000 19,000 18,000 17,000 16,000 15,000 Economics Worksheets- www.acdcecon.com 14,000 13,000 2004 2006 2008 2010 2012 2014 2016 2018 2020 2022 1. Did the US economy most likely experience a negative output gap or a * 1 point positive output gap in 2010? Explain your reasoning. Your answer 2. Identify a period of time when the US most likely experienced no cyclical * 1 point unemployment. Explain your reasoning. Your answer 3. If 2% GDP growth results in full employment, what would likely happen to * 1 point the price level in the long-run if GDP growth reached 6% in the short run? Explain. G h docs.google.com C + G Macro Topic... G Macro Topic... #3.3 Short-Ru.. G 3.4 Long-Ru.. G 3.5 Equilibrium. G 3.6 Changes... G 3.7 Long-Run.. G G Macro Topic... Dashboard 3. If 2% GDP growth results in full employment, what would likely happen to * 1 point the price level in the long-run if GDP growth reached 6% in the short run? Explain. Your answer 4. Draw a correctly labeled AS/AD model with AD, SRAS, and LRAS curves * 1 point representing the U.S. economy in 2006. Indicate the price level, PL1, and output level, Y1 and full employment output, YF. 1 Add file 5. Draw a correctly labeled AS/AD model with AD, SRAS, and LRAS curves * 1 point representing the U.S. economy in 2020. Indicate the price level, PL1, and output level, Y1 and full employment output, YF. 1 Add file Copyright Jacob Clifford. Annual license required. Do not use unless you have purchased a license Submit Clear form Never submit passwords through Google Forms. This form was created inside of Loudoun County Public Schools. Report Abuse Google Forms G h docs.google.com C + G Macro Topic... G Macro Topic... |3.3 Short-Ru.. G 3.4 Long-Ru. G 3.5 Equilibrium. G 3.6 Changes... G 3.7 Long-Run. G 3.8.1- Fiscal. G Macro Topic... Dashboard Part 1 - Draw It AP MACROECONOMICS TOPIC 3.6 TEACHER WORKSHEETS Changes in the AD-AS Model LURP Ultimate ReviewPacket.com Part 1: Draw It- For each of the following scenarios show the short-run effect on aggregate demand, short-run aggregate supply, and long-run aggregate supply. Label the initial price level PL, and the new price level and output, PL, and Yz. Start each graph at full-employment, labeled YF. 1. In the mid-1990s, Silicon Valley improved microprocessors, leading to * 1 point technological advancements in production 1 Add file 2. In 2005, Hurricane Katrina destroyed oil and natural gas refining capacity * 1 point in the Gulf of Mexico 1 Add file 3. In 1999, businesses purchased upgraded machines and computers to * 1 point prepare for the year 2000 L Add file 4. In 2008, the global financial crisis decreased consumer and investment * 1 point spending 1 Add fileEm)s ', @ docs.google.com @ E () @ Macro Topic @ Macro Topic. SR @ 3.4 Long-Ru, @ 35 Equilibriu 36 Changes... (G RRAR R [ RERRE @ Macro Topic (] pashboard 5. In 2001, the dot-com bubble burst, lowering the stock market and * 1 point decreasing consumer confidence & Add file 6. In 2019, consumer confidence began rising and the housing market * 1 point stabilized & Add file Part 2 - Draw It Again Part 2: More Practice- For each of the following scenarios show the effect on AD, SRAS, and LRAS. Label the initial price level PL, and the new price level and output, PL, and Y,. Start each graph with either a positive output gap or a negative output gap, depending on the scenario. 7. To combat a recession, Congress passed the Economic Stimulus Act of * 1 point 2008 &, Add file 8. In 2018 with unemployment at 4.1%, the Tax Cuts and Jobs Act of 2017 * 1 point went into effect = 2, Add file G h docs.google.com C + G Macro Topic... G Macro Topic... |3.3 Short-Ru.. G 3.4 Long-Ru.. G 3.5 Equilibrium.. G 3.6 Changes... G 3.7 Long-Run.. G 3.8.1- Fiscal. G Macro Topic... Dashboard 9. Still feeling the effects of the Great Depression, the US increased military * 1 point spending and entered World War 2 in 1941 L Add file 10. To fight stagflation in the 1979, Paul Volcker, the Chairman of the * 1 point Federal Reserve, increased interest rates to lower consumption 1 Add file Part 3 - Stretch Your Thinking Part 3: Stretch Your Thinking- Complete the following. 11. Inflation can be caused by changes in aggregate demand (demand-pull) * 1 point or changes in aggregate supply (cost-push). In your opinion, which of these two are worse? Explain your reasoning. Your answer 12. In 2022, the central bank of the United States enacted policies to * 1 point increase interest rates. Explain how this would affect both aggregate demand and aggregate supply. G h docs.google.com C + G Macro Topic... G Macro Topic... |3.3 Short-Ru.. G 3.4 Long-Ru.. G 3.5 Equilibrium.. G 3.6 Changes... G 3.7 Long-Run.. G 3.8.1- Fiscal. G Macro Topic... Dashboard Part 1 - Graph It TEACHER WORKSHEETS AP MACROECONOMICS TOPIC 3.7 Long-Run Self-Adjustment BURP Ultimate ReviewPacket.com Part 1: Graph It- Draw a correctly labeled graph of aggregate demand, aggregate supply, and long-run aggregate supply. Start each graph at full-employment. Show what happens in both the short-run and the long-run if the economy is given time to self-adjust. Start each graph at full-employment, labeled Y. 1. Consumer spending increases as consumers confidence increases * 1 point 1 Add file 2. Congress passes a bill dramatically reducing government spending * 1 point 1 Add file 3. Explain the relationship between the flexibility of wages (and resource * 1 point prices) and the duration of recessionary gaps. Your answer Part 2 - Making Connections Part 2: Making Connections- Use the information from the March 2019 Forbes article to complete the following. "African economies are primed to be ranked among the fastest growing in the world in 2019. According to the International Monetary Fund (IMF), projections for the region's economic growth next year has been bumped up to 3.5% - 4% from earlier projections of 3% growth. Among those nations primed for growth is Zambia,Em)s @ Macro Topic @ Macro Topic. 1 3 Short-Ru. @ docs.google.com @ 3.4 Long-Ru [ @ 36 Changes @ 37 Long-Run.. Part 2: Making Connections- Use the information from the March 2019 Forbes article to complete the following. \"African economies are primed to be ranked among the fastest growing in the world in 2019. According to the International Monetary Fund (IMF), projections for the region's economic growth next year has been bumped up to 3.5% - 4% from earlier projections of 3% growth. Among those nations primed for growth is Zambia, which thanks to the steady rebound of commodity prices, an improvement in the global economy and improved capital market access, enjoyed 5% growth in the third quarter of 2018...The highest inflation rate of 2018 was recorded at 8.3% in October..." 4. According to this article excerpt, is the Zambian economy most likely * 1 point experiencing a positive output gap or a negative output gap? Your answer 5. What will most likely happen to nominal wages in Zambia in the long-run? * 1 point Explain. Your answer 6. Draw a correctly labeled AS/AD model with AD, SRAS, and LRAS curves * 1 point representing the Zambia economy with the output gap you identified in question #4. Label the price level, PL1, and output level, Y1 and full employment output, YF. & Add file 7. Assume that wages and resource prices adjust in the long-run. Draw the * 1 point change that occurs on the graph and label the price level, PL2 and output level, Y2. [ A (w (] pashboard Em)s @ Macro Topic @ Macro Topic. 1 3 Short-Ru.. @ docs.google.com @ 3.4 Long-Ru @ 35 Equilibriu @ 36 Changes @ 37Long-Run... 6. Draw a correctly labeled AS/AD model with AD, SRAS, and LRAS curves representing the Zambia economy with the output gap you identified in question #4. Label the price level, PL1, and output level, Y1 and full employment output, YF. * 1 point &, Add file 7. Assume that wages and resource prices adjust in the long-run. Draw the * 1 point change that occurs on the graph and label the price level, PL2 and output level, Y2. & Add file 8. Assume instead that Zambia experiences a significant increase in * 1 point investment and capital stock. How would this affect the LRAS? Explain. Your answer Copyright Jacob Clifford. Annual license required. Do not use unless you have purchased a license Never submit passwords through Google Forms. This form was created inside of Loudoun County Public Schools. Report Abuse Google Forms - Fiscal [CIEEERCS [ A (w (] pashboard docs.google.com C + G h G 3.7 Long-Run.. G 3.8.1- Fiscal... G Macro Topic... Dashboard G Macro Topic... G Macro Topic... # 3.3 Short-Ru.. G 3.4 Long-Ru.. G 3.5 Equilibrium.. G 3.6 Changes... TEACHER WORKSHEETS AP MACROECONOMICS TOPIC 3.8 URP Fiscal Policy UltimateReviewPacket.com Part 1: Graph Practice- Use the graph to the right to complete the following. Price Level LRAS SRAS PL PL , PL. PL AD GDP 1. What is the short-run equilibrium price level and output? * 1 point Your answer 2. Identify the short-run equilibrium price level and output if consumer * 1 point spending fell? Your answer 3. Identify the short-run equilibrium price level and output if investment * 1 point increased? Your answerEm)s ', @ docs.google.com @ E () @ Macro Topic @ Macro Topic. R @ 3.4 Long-Ru @ 35 Equilibriu @ 36 Changes PR 381-Fiscal... @ Macro Topic (] pashboard 4. |dentify the short-run equilibrium price level and output after a negative ~ * 1 point supply shock? Your answer 5. If the real GDP was Y3, what types of unemployment would exist? * 1 point Your answer 6. If the real GDP was Y2, what types of unemployment would exist? * 1 point Your answer 7. Identify the long-run equilibrium price level and output if wages and * 1 point resource prices are flexible. Explain. Your answer 8. Assume wages and resource prices are flexible and the economy * 1 point reached long-run equilibrium. What would be the long-run equilibrium output if there was an increase in consumer spending? Explain. Your answer h docs.google.com C + G G Macro Topic... |3.3 Short-Ru.. G 3.4 Long-Ru.. G 3.5 Equilibrium.. G 3.6 Changes... G 3.7 Long-Run.. G 3.8.1- Fiscal.. G Macro Topic... Dashboard G Macro Topic... Part 2: Multiplier Practice Part 2: Multiplier Practice- Use the graph to the right to answer the questions. Price Level SRAS PL LRAS PL , PL 2 PL, AD $100 $200 $300 $400 GDPR in billions Copyright Jacob Clifford 2020. www.ACDCecon.com Annual license required. Do not use unless you have purchased a license 9. Assume the MPC was .8. What is the least amount the government could * 1 point spend to achieve full employment? Show your work. Your answer 10. Assume the MPC is .8. What is the least amount the government could * 1 point cut taxes to achieve full employment? Show your work. Your answerG h + docs.google.com C G Macro Topic... G Macro Topic... |3.3 Short-Ru.. G 3.4 Long-Ru.. G 3.5 Equilibrium.. G 3.6 Changes... G 3.7 Long-Run.. G 3.8.1- Fiscal... G Macro Topic... Dashboard 11. Assume the MPC is .5 instead. What is the least amount the * 1 point government could cut taxes to achieve full employment? Show your work. Your answer 12. If an increase in consumer spending of $10 billion would increase real * 1 point GDP to $300 billion, what is the marginal propensity to consume? Your answer Part 3: Stretch Your Thinking Part 3: Stretch Your Thinking- Complete the following. 13. Why does SRAS eventually become vertical? * 1 point Your answer Copyright Jacob Clifford. Annual license required. Do not use unless you have purchased a license Submit Clear form G h docs.google.com + G Macro Topic... G Macro Topic... |3.3 Short-Ru.. G 3.4 Long-Ru. G 3.5 Equilibrium. G 3.6 Changes... G 3.7 Long-Run... G 3.8.1- Fiscal.. G Macro Topic.. Dashboard Automatic Stabilizers UltimateReviewPacket.com Part 1: Putting It Together- Identify whether the following are most likely examples of discretionary fiscal policy or on-discretionary fiscal policy (automatic stabilizers). 1. During the Great Recession (2008-2009) the US Congress passes "Cash * 1 point for Clunkers" law offering incentives to buy new cars Your answer 2. The number of people who received unemployment benefits increased by * 1 point over 8 million in 2009 from 2007 Your answer 3. In 2018, Congress lowered the top marginal tax rate from 39.6 to 37% * 1 point Your answer 4. From 2013-2018, income-based transfer payments decreased * 1 point Your answer 5. From 2008 to 2009 federal income tax revenue fell by over $200 billion * 1 point' @ docs.google.com (= R e (AR @ 35 Equilibriu @ 36cha Long-Run @ 38.-Fiscal @ Macro Topic... 4. From 2013-2018, income-based transfer payments decreased * 1 point Your answer 5. From 2008 to 2009 federal income tax revenue fell by over $200 billion * 1 point Your answer 6. In 2009 Congress expanded Medicaid, TANF, and SNAP, allowing more ~ * 1 point people to qualify Your answer 7. In March 2020, the US government passed the Coronavirus Aid, Relief, ~ * 1 point and Economic Security Act (CARES Act), a $2.2 trillion economic stimulus bill Your answer Part 2 Check Your Understanding Part 2 Check Your Understanding- Use the information in the graph to answer the questions. Low-Income Entitlement Spending Outside Health Set to Fall Back to Prior 40-Year Average n Spending as a percent of GDP 25% e0)| ', @ docs.google.com @ E () @ Macro Topic SR R ] @ 3.4 Long-Ru (RIS @ 3.6 Changes 7 Long-Run @ Macro Topic... LTJ PETYIeETEe} Part 2 Check Your Understanding- Use the information in the graph to answer the questions. Low-Income Entitlement Spending Outside Health Set to Fall Back to Prior 40-Year Average Spending as a percent of GDP 2.5% 20 0.0 + L L L L L i L 1972 1977 1982 1987 192 1997 2002 2007 2012 2017 202 Copyright Jacob Clifford 2020. www.ACDCecon.com Annual license required. Do not use unless you have purchased a license 8. Based on this chart, what was the likely condition of the economy from * 1 point 2007-20127? Explain your reasoning. Your answer 9. If transfer payments don't directly count towards GDP, how does an * 1 point increase in social services programs (like income based entitlements) promote economic recovery? Your answer 10. What most likely happened to tax revenue from income taxes between * 1 point 2007-2012? Explain why this is an example of an automatic stabilizer. n Your answer Em)s ', @ docs.google.com @ E () @ Macro Topic ERSR LT R @ 3.4 Long-Ru (RIS @ 36 Changes PR [ RERRE @ Macro Topic... (] pashboard 9. If transfer payments don't directly count towards GDP, how does an * 1 point increase in social services programs (like income based entitlements) promote economic recovery? Your answer 10. What most likely happened to tax revenue from income taxes between * 1 point 2007-2012? Explain why this is an example of an automatic stabilizer. Your answer 11. Identify one advantage that automatic stabilizers have over * 1 point discretionary fiscal policy. Your answer Copyright Jacob Clifford. Annual license required. Do not use unless you have purchased a license Never submit passwords through Google Forms. This form was created inside of Loudoun County Public Schools. Report Abuse Google Forms
Step by Step Solution
There are 3 Steps involved in it
Step: 1
Get Instant Access to Expert-Tailored Solutions
See step-by-step solutions with expert insights and AI powered tools for academic success
Step: 2
Step: 3
Ace Your Homework with AI
Get the answers you need in no time with our AI-driven, step-by-step assistance