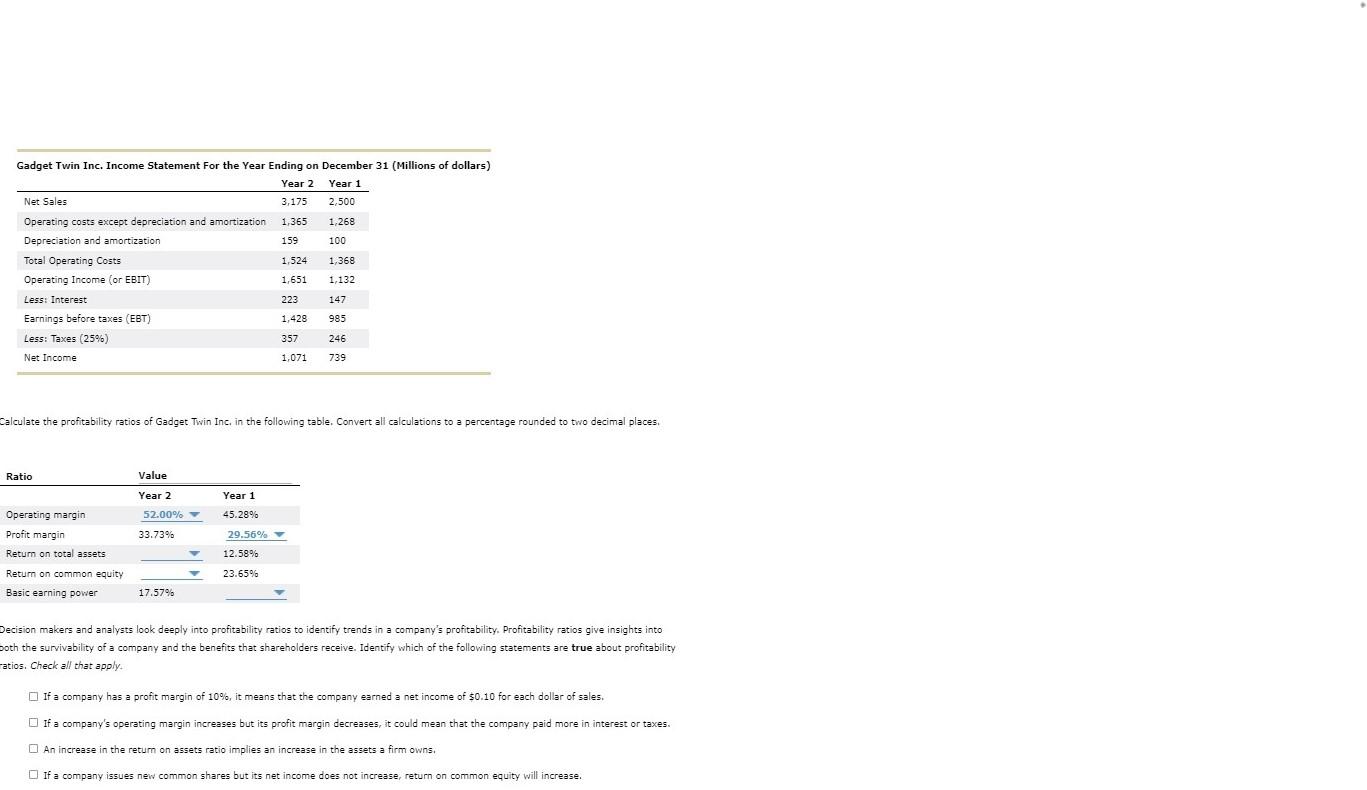
Gadget Twin Inc. Income Statement For the Year Ending on December 31 (Millions of dollars) Year 2 Year 1 Net Sales 3,175 2,500 Operating costs except depreciation and amortization 1,365 1,268 Depreciation and amortization 159 100 Total Operating costs 1.524 1,368 Operating Income (or EBIT) 1,651 1,132 Less: Interest 223 147 Earnings before taxes (EBT) 1,428 985 Less: Taxes (25%) 357 246 Net Income 1,071 739 Calculate the profitability ratios of Gadget Twin Inc. in the following table. Convert all calculations to a percentage rounded to two decimal places Ratio Value Year 2 Year 1 52.00% 45.28% Operating margin Profit margin Return on total assets 33.73% 29.56% 12.58% Return on common equity 23.65% % Basic earning power 17.57 Decision makers and analysts look deeply into profitability ratios to identify trends in a company's profitability. Profitability ratios give insights into both the survivability of a company and the benefits that shareholders receive. Identify which of the following statements are true about profitability ratios. Check all that apply. If a company has a profit margin of 10%, it means that the company earned a net income of $0.10 for each dollar of sales. If a company's operating margin increases but its profit margin decreases, it could mean that the company paid more in interest or taxes. An increase in the return on assets ratio implies an increase in the assets a firm owns, If a company issues new common shares but its net income does not increase, return on common equity will increase. Gadget Twin Inc. Income Statement For the Year Ending on December 31 (Millions of dollars) Year 2 Year 1 Net Sales 3,175 2,500 Operating costs except depreciation and amortization 1,365 1,268 Depreciation and amortization 159 100 Total Operating costs 1.524 1,368 Operating Income (or EBIT) 1,651 1,132 Less: Interest 223 147 Earnings before taxes (EBT) 1,428 985 Less: Taxes (25%) 357 246 Net Income 1,071 739 Calculate the profitability ratios of Gadget Twin Inc. in the following table. Convert all calculations to a percentage rounded to two decimal places Ratio Value Year 2 Year 1 52.00% 45.28% Operating margin Profit margin Return on total assets 33.73% 29.56% 12.58% Return on common equity 23.65% % Basic earning power 17.57 Decision makers and analysts look deeply into profitability ratios to identify trends in a company's profitability. Profitability ratios give insights into both the survivability of a company and the benefits that shareholders receive. Identify which of the following statements are true about profitability ratios. Check all that apply. If a company has a profit margin of 10%, it means that the company earned a net income of $0.10 for each dollar of sales. If a company's operating margin increases but its profit margin decreases, it could mean that the company paid more in interest or taxes. An increase in the return on assets ratio implies an increase in the assets a firm owns, If a company issues new common shares but its net income does not increase, return on common equity will increase