Question
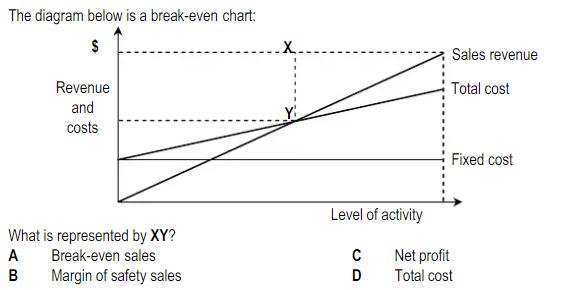
The diagram below is a break-even chart: $ Revenue and costs What is represented by XY? Break-even sales AB B Margin of safety sales

The diagram below is a break-even chart: $ Revenue and costs What is represented by XY? Break-even sales AB B Margin of safety sales Level of activity C D Sales revenue Total cost Fixed cost Net profit Total cost
Step by Step Solution
3.43 Rating (159 Votes )
There are 3 Steps involved in it
Step: 1
Answer A Break even sales Explanation The Breakup even chart shows the level a...
Get Instant Access to Expert-Tailored Solutions
See step-by-step solutions with expert insights and AI powered tools for academic success
Step: 2

Step: 3

Ace Your Homework with AI
Get the answers you need in no time with our AI-driven, step-by-step assistance
Get StartedRecommended Textbook for
Accounting
Authors: Jonathan E. Duchac, James M. Reeve, Carl S. Warren
23rd Edition
978-0324662962
Students also viewed these Accounting questions
Question
Answered: 1 week ago
Question
Answered: 1 week ago
Question
Answered: 1 week ago
Question
Answered: 1 week ago
Question
Answered: 1 week ago
Question
Answered: 1 week ago
Question
Answered: 1 week ago
Question
Answered: 1 week ago
Question
Answered: 1 week ago
Question
Answered: 1 week ago
Question
Answered: 1 week ago
Question
Answered: 1 week ago
Question
Answered: 1 week ago
Question
Answered: 1 week ago
Question
Answered: 1 week ago
Question
Answered: 1 week ago
Question
Answered: 1 week ago
Question
Answered: 1 week ago
Question
Answered: 1 week ago
Question
Answered: 1 week ago
Question
Answered: 1 week ago
Question
Answered: 1 week ago
Question
Answered: 1 week ago
View Answer in SolutionInn App


