General Motors
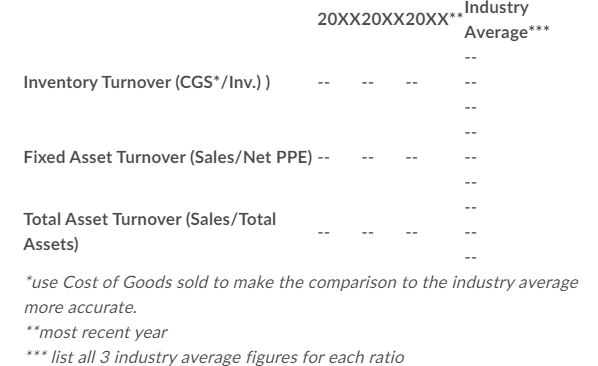
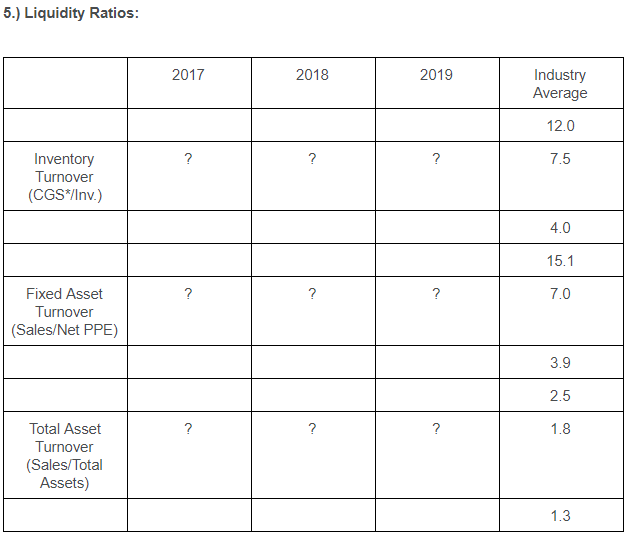
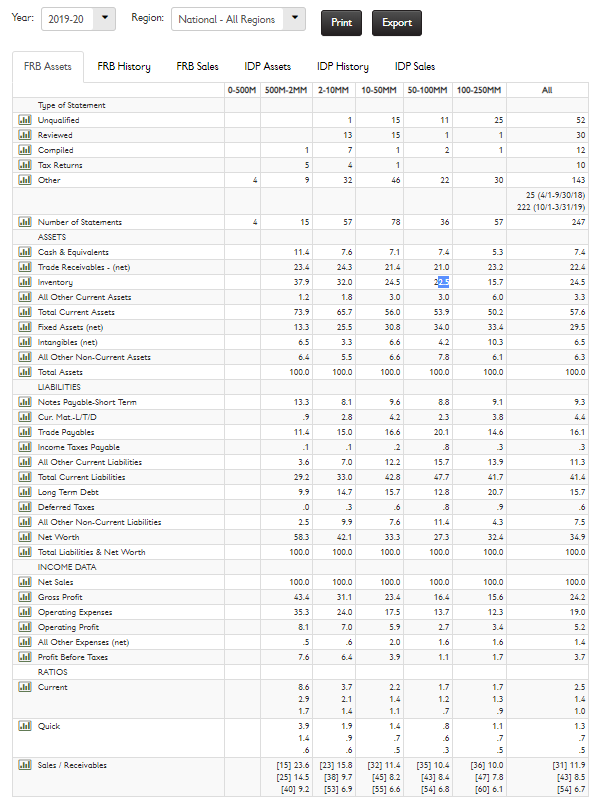
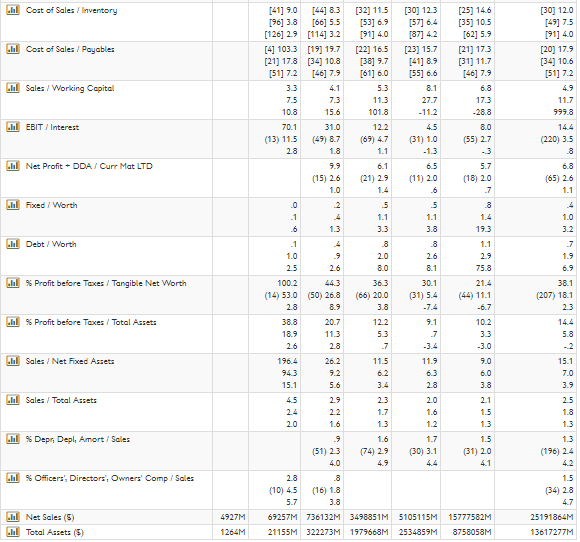
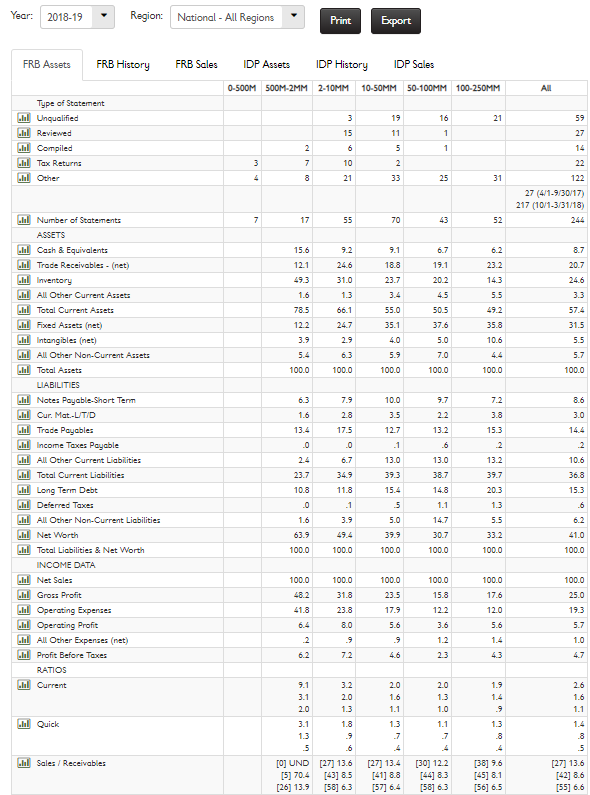
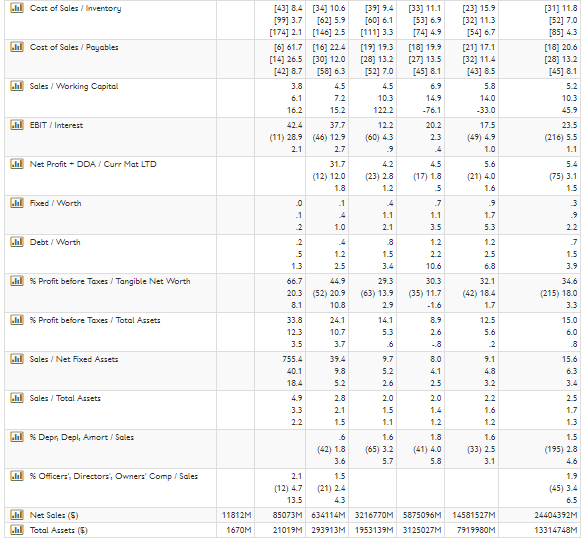
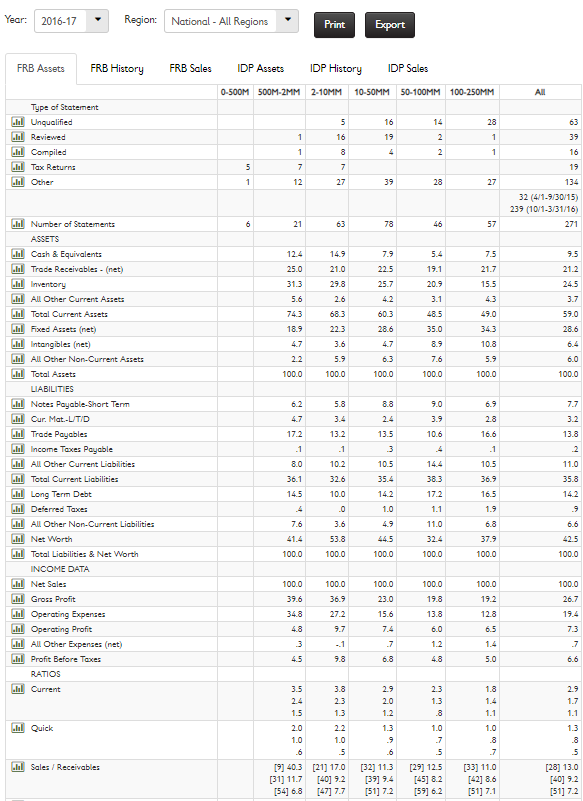
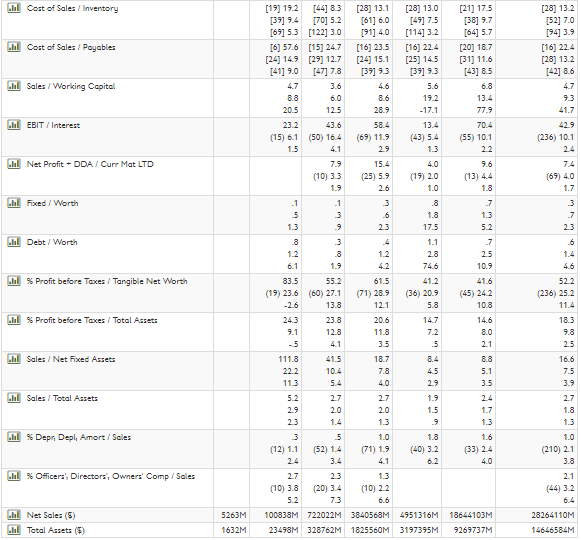
20xX20XX20XX* Industry Average*** Inventory Turnover (CGS*/Inv.)) Fixed Asset Turnover (Sales/Net PPE) -- Total Asset Turnover (Sales/Total Assets) *use Cost of Goods sold to make the comparison to the industry average more accurate. **most recent year *** list all 3 industry average figures for each ratio 5.) Liquidity Ratios: 2017 2018 2019 Industry Average 12.0 ? ? ? 7.5 Inventory Turnover (CGS/Inv.) 4.0 15.1 ? ? ? 7.0 Fixed Asset Turnover (Sales/Net PPE) 3.9 2.5 ? ? ? 1.8 Total Asset Turnover (Sales/Total Assets) 1.3 Year: 2019-20 Region: National - All Regions Print Export FRB Assets FRB History FRB Sales IDP Assets IDP History IDP Sales 0-500M 500M-2MM 2-10MM 10-50MM 50-100MM 100-250MM All 1 15 11 25 52 30 13 15 1 Type of Statement Il Unqualified Dl Reviewed Il Compiled Tax Returns Il Other 1 1 1 7 1 12 5 10 4 32 46 30 143 25 (4/1-9/30/18) 222 (10/1-3/31/19) 4 15 57 78 36 57 7.6 7.1 7.4 5.3 11.4 23.4 21.0 243 32.0 23.2 15.7 1.8 21.4 24.5 3.0 56.0 30.8 6.0 37.9 1.2 73.9 13.3 6.5 3.3 3.0 53.9 50.2 65.7 255 34.0 33.4 57.6 29.5 6.5 6.6 103 6.4 3.3 5.5 100.0 6.6 7.8 6.1 6.3 100.0 100.0 1000 100.0 100.0 13.3 8.1 8.8 9.3 9.6 4.2 9.1 3.8 2.8 2.3 11.4 15.0 16.6 20.1 14.6 16.1 .1 2 .8 3 Il Number of Statements ASSETS Il Cash & Equivalents Dl Trade Receivables - (net) Il Inventory ll All Other Current Assets Dl Total Current Assets Il Fixed Assets (net) Il Intangibles (net) Dul All Other Non-Current Assets . Total Assets LIABILITIES Il Notes Payable Short Term Il Qur. Mat.-LITID Il Trade Payables Il Income Taxes Payable ll All Other Current Liabilities Il Total Current Liabilities Il Long Term Debt Il Deferred Taxes Il All Other Non-Current Liabilities Il Net Worth Il Total Liabilities & Net Worth INCOME DATA Il Net Sales Il Gross Profit Lil Operating Expenses Lil Operating Profit Dol All Other Expenses (net) Il Profit Before Taxes RATIOS Il Ourrent 3 13.9 12.2 15.7 11.3 3.6 29.2 .1 7.0 33.0 147 3 47.7 41.7 41.4 42.8 15.7 12.8 15.7 20.7 9 .0 .6 .8 .6 2.5 7.6 11.4 7.5 58.3 42.1 33.3 27.3 32.4 34.9 100.0 100.0 100.0 100.0 100.0 100.0 100.0 100.0 100.0 100.0 100.0 43.4 31.1 16.4 15.6 35.3 240 100.0 23.4 17.5 5.9 2.0 13.7 123 19.0 8.1 7.0 2.7 5.2 3.4 1.6 5 1.6 7.6 6.4 3.9 1.1 1.7 3.7 2.5 8.6 2.9 1.7 3.7 2.1 1.4 1.9 2.2 1.4 1.1 1.7 1.2 7 1.7 1.3 1.0 Il Quick 1.1 3.9 1.4 [15] 23.6 [25] 14.5 [40] 9:2 .6 [23] 15.8 [38] 9.7 [53] 6.9 Il Sales / Receivables .8 .6 3 (35) 10.4 [43] 8.4 [54] 6.8 7 5 (32) 11.4 [45] 8.2 [55] 6.6 1.3 .7 5 (31) 11.9 [43] 8.5 [54] 6.7 5 [36] 10.0 [47] 7.8 [60] 6.1 . Cost of Sales/Inventory [25] 14.6 [35) 10.5 [62] 5.9 [21) 173 (31) 11.7 [46] 79 [30) 120 [49] 7.5 [91] 4.0 [20] 17.9 [34) 10.6 [51] 7.2 ul Cost of Sales / Payables Il Sales / Working Capital 11.7 999.8 10.3 EBIT / Interest 2.8 17.3 -28.8 8.0 (55) 2.7 -3 5.7 (18) 2.0 .7 (220) 3.5 .8 Il Net Profit - DDA / Curr Mat LTD 6.8 (65) 2.6 1.1 1.0 Il Fixed / Worth 5 .8 19.3 4 1.0 3.2 7 1.9 Il Debt / Worth 1.1 [44] 83 (32) 11.5 [30) 123 [96] 3.8 [66] 5.5 [53] 6.9 [57] 6.4 [126] 2.9 [114] 3.2 [91] 4.0 [87] 4.2 [4] 1033 [19] 19.7 [22] 16.5 [23] 15.7 [21] 17.8 [34) 10.8 [38] 9.7 [41] 8.9 [51] 7.2 [46] 7.9 [61] 6.0 [55] 6.6 3.3 5.3 8.1 7.5 7.3 11.3 27.7 15.6 101.8 - 11.2 70.1 31.0 122 (13) 11.5 (49) 8.7 (69) 4.7 (31) 1.0 1.8 1.1 -1.3 6.1 6.5 (15) 2.6 (21) 2.9 (11) 2.0 .6 0 5 .1 1.1 1.1 6 1.3 3.3 3.8 .1 1.0 9 2.0 2.6 2.5 2.6 8.0 8.1 1002 443 36.3 30.1 (14) 53.0 (50) 268 (66) 20.0 (31) 5.4 2.8 8.9 3.8 -7.4 38.8 20.7 122 9.1 18.9 11.3 5.3 2.6 2.8 7 1964 26.2 11.5 11.9 9.2 6.2 6.3 15.1 5.6 3.4 2.8 4.5 2.9 2.3 2.0 2.4 2.2 1.7 1.6 2.0 1.6 1.3 1.2 9 1.6 1.7 (51) 23 (74) 2.9 (30) 3.1 4.0 4.9 4.4 2.8 .8 (10) 4.5 (16) 1.8 5.7 3.8 69257M 736132M 3498351M 5105115M 21155M 322273M 1979668M 2534859M Il % Profit before Taxes / Tangible Net Worth 75.8 21.4 (44) 11.1 -6.7 102 3.3 38.1 (207) 18.1 23 Il % Profit before Taxes / Total Assets 5.8 Il Sales / Net Fixed Assets 9.0 6.0 3.8 15.1 7.0 3.9 Il Sales/Total Assets 2.1 1.5 1.3 2.5 1.8 1.3 1.3 (196) 2.4 lol % Depr Depl, Amort / Sales 1.5 (31) 2.0 4.1 Il % Officers', Directors, Owners' Comp/Sales 1.5 (34) 2.8 4.7 lub Net Sales (5) Il Total Assets (5) 4927M 1264M 15777582M 8758058M 25191864M 13617277M Year: 2018-19 Region: National - All Regions Print Export FRB Assets FRB History FRB Sales IDP Assets IDP History IDP Sales 0-500M 500M-2MM 2.10MM 10-50MM 50-100MM 100-250MM All 19 16 21 3 15 59 27 11 1 Type of Statement . Unqualified ul Reviewed Il Compiled Tax Returns Il Other 6 1 14 5 2 3 7 10 22 4 21 33 25 31 122 27 (4/1-9/30/17) 217 (10/1-3/31/18) 7 17 55 70 43 52 15.6 8.7 9.2 24.6 12.1 9.1 18.8 23.7 19.1 20.7 6.2 23.2 143 5.5 20.2 24.6 31.0 13 66.1 4.5 3.3 1.6 78.5 122 3.9 55.0 35.1 50.5 37.6 5.0 57.4 31.5 35.8 2.9 4.0 10.6 5.5 5.4 6.3 5.9 7.0 5.7 100.0 100.0 100.0 100.0 100.0 100.0 6.3 7.9 10.0 9.7 7.2 8.6 1.6 3.8 3.0 2.8 175 .0 3.5 12.7 13.4 13.2 15.3 .1 2. Il Number of Statements ASSETS Il Cash & Equivalents Dl Trade Receivables - (net) Inventory ll All Other Current Assets Il Total Current Assets Il Fixed Assets (net) Il Intangibles (net) Dl All Other Non-Current Assets Il Total Assets LIABILITIES Il Notes Payable-Short Term Il Qur. Mat.-LITID Il Trade Payables .ll Income Taxes Payable ll All Other Current Liabilities DI Total Current Liabilities l Long Term Debt Il Deferred Taxes .ll All Other Non.Current Liabilities Il Net Worth Il Total Liabilities & Net Worth INCOME DATA Il Net Sales Lul Gross Profit all Operating Expenses Lil Operating Profit lol All Other Expenses (net) Il Profit Before Taxes RATIOS Dl Ourrent 13.0 13.0 39.3 10.6 36.8 23.7 34.9 38.7 132 39.7 20.3 1.3 10.8 11.8 15.4 14.8 15.3 .1 5 1.1 .0 1.6 3.9 5.0 5.5 6.2 41.0 63.9 49.4 39.9 33.2 30.7 100.0 100.0 100.0 100.0 100.0 100.0 100.0 100.0 100.0 100.0 48.2 100.0 23.5 100.0 15.8 31.8 17.6 25.0 41.8 23.8 17.9 12.2 12.0 19.3 6.4 8.0 5.6 3.6 5.6 5.7 1.2 1.4 1.0 4.7 7.2 4.6 23 4.3 2.0 1.6 1.1 2.0 1.3 1.0 1.9 1.4 9 2.6 1.6 1.1 Gol Quick 9.1 3.2 3.1 2.0 2.0 1.3 3.1 1.8 1.3 5 .6 [O] UND [27] 13.6 [5] 70.4 [43] 8.5 [26] 13.9 [58] 6.3 1.3 .7 1.1 7 4 1.3 .8 4 5 Il Sales/ Receivables [27] 13.4 [41] 8.8 [57] 6.4 [30] 12.2 [44] 8.3 [58] 6.3 [38] 9.6 [45] 8.1 [56] 6.5 [27] 13.6 [42] 8.6 [55] 6.6 .nl Cost of Sales / Inventory [33] 11.1 [53] 6.9 [23] 15.9 [32] 113 [54] 6.7 (21) 17.1 (32) 11.4 [43] 8.5 Il Cost of Sales / Payables [39] 9.4 [60] 6.1 [111] 33 [19) 193 [28] 13.2 [52] 7.0 4.5 10.3 1222 122 (60) 4.3 9 Il Sales / Working Capital [43] 8.4 [34) 10.6 [99] 3.7 [62] 5.9 [174] 2.1 [146] 2.5 [6] 61.7 [16] 22.4 [14] 26.5 [30] 12.0 [42] 8.7 [58] 6.3 3.8 4.5 6.1 7.2 16.2 15.2 37.7 (11) 28.9 (46) 12.9 2.1 31.7 (12) 12.0 1.8 0 .1 .1 2. 1.0 [18] 19.9 [27] 13.5 [45] 8.1 6.9 14.9 -76.1 20.2 23 4 5.8 14.0 -33.0 [31] 11.3 [52] 7.0 [85] 43 [18] 20.6 [28] 13.2 [45] 8.1 5.2 10.3 45.9 23.5 (216) 5.5 1.1 5.4 (75) 3.1 1.5 I EBIT / Interest 173 2.7 Il Net Profit - DDA / Curr Mat LTD 4.5 (17) 1.8 5 Il Fixed / Worth (23) 2.8 1.2 4 1.1 2.1 7 1.1 3.5 2.2 Dl Debt / Worth 1.2 ini 1.0 5.6 (21) 4.0 1.6 9 1.7 5.3 1.2 2.5 6.8 32.1 (42) 18.4 1.7 12.5 5.6 1.5 5 1.3 1.2 2.5 10.6 .7 1.5 3.9 34.6 (215) 18.0 3.3 Il % Profit before Taxes / Tangible Net Worth 29.3 (63) 13.9 2.9 30.3 (35) 11.7 -1.6 66.7 20.3 (52) 20.9 8.1 10.8 33.8 24.1 123 10.7 3.5 3.7 DI % Profit before Taxes/Total Assets 14.1 5.3 2.6 15.0 6.0 .8 15.6 6.3 3.4 Dl Sales / Net Fixed Assets 755.4 Il Sales / Total Assets 2.5 1.7 13 lol % Depr, Depl, Amort / Sales 8.0 9.1 40.1 5.2 4.1 4.8 18.4 5.2 2.6 2.5 3.2 2.8 2.0 2.0 2.2 3.3 2.1 1.5 1.4 1.6 2.2 1.5 1.1 1.2 1.2 .6 1.6 1.8 1.6 (42) 1.8 (65) 3.2 (41) 4.0 (33) 2.5 3.6 5.7 5.8 3.1 2.1 1.5 (12) 47 (21) 2.4 13.5 85073M 634114M 3216770M 5875096M 14581527M 21019M 293913M 1953139M 3125027M 7919980M 1.5 (195) 2.8 Il % Officers', Directors, Owners' Comp/Sales 1.9 (45) 3.4 6.5 24404392M 13314748M bol Net Sales (5) Il Total Assets (5) 11812M 1670M Year: 2016-17 Region: National - All Regions Print Export FRB Assets FRB History FRB Sales IDP Assets IDP History IDP Sales 0-500M 500M-2MM 2-10MM 10-50MM 50-100MM 100-250MM All 5 16 14 28 16 19 39 Type of Statement Il Unqualified Il Reviewed Il Compiled Tax Returns l Other 1 1 2 2 1 1 4 16 5 7 19 1 12 27 39 28 27 134 32 (4/1-9/30/15) 239 (10/1.3/31/16) 271 6 21 63 78 46 57 124 5.4 149 21.0 7.9 22.5 25.7 7.5 21.7 25.0 31.3 19.1 9.5 21.2 245 29.8 20.9 15.5 5.6 2.6 683 743 18.9 49.0 3.1 48.5 35.0 60.3 28.6 3.7 59.0 28.6 223 34.3 4.7 3.6 4.7 10.8 6.3 5.9 6.0 2.2 100.0 5.9 100.0 7.6 100.0 100.0 100.0 100.0 5.8 8.8 9.0 6.9 3.4 2.4 3.9 2.8 166 7.7 3.2 138 17.2 13.2 13.5 10.6 .1 .1 3 4 .1 Il Number of Statements ASSETS Il Cash & Equivalents .D Trade Receivables - (net) l Inventory U All Other Current Assets Il Total Current Assets Il Fixed Assets (net) Il Intangibles (net) ll All Other Non-Current Assets Il Total Assets LIABILITIES Il Notes Payable-Short Term Dl Our. Mat.-L/TID Il Trade Payables Il Income Taxes Payable Il All Other Current Liabilities DI Total Current Liabilities Long Term Debt Dl Deferred Taxes ll All Other Non-Current Liabilities Il Net Worth Dl Total Liabilities & Net Worth INCOME DATA Il Net Sales Il Gross Profit Lil Operating Expenses Dl Operating Profit lol All Other Expenses (net) Il Profit Before Texes RATIOS Il Current 8.0 105 10.2 32.6 10.5 36.9 36.1 35.4 38.3 11.0 35.8 14.2 14.5 14.2 17.2 16.5 4 10.0 .0 3.6 1.0 1.9 7.6 11.0 6.6 42.5 53.8 44.5 100.0 32.4 100.0 37.9 100.0 100.0 100.0 100.0 100.0 100.0 100.0 100.0 100.0 36.9 100.0 19.8 39.6 23.0 19.2 26.7 34.8 27.2 15.6 13.8 12.8 19.4 7.3 9.7 7.4 6.0 3 7 1.2 7 9.8 6.8 4.8 5.0 6.6 2.9 2.0 1.2 2.3 1.3 1.8 1.4 1.1 2.9 1.7 1.1 1.3 .8 Il Quick 1.3 3.5 3.8 2.4 2.3 1.5 1.3 2.0 2.2 1.0 1.0 5 [9] 40.3 [21] 17.0 (31) 11.7 [40] 9.2 [54] 6.8 [47] 7.7 1.0 .6 [32] 113 [39] 9.4 [51] 7.2 Il Sales/Receivables 1.0 7 5 [29] 12.5 [45] 8.2 [59] 6.2 7 (33) 11.0 [42] 8.6 [51] 7.1 (28) 13.0 [40] 9.2 [51] 7.2 .nl Cost of Sales / Inventory Del Cost of Sales / Payables [28] 13.2 [52] 7.0 [94] 3.9 [16) 22.4 [28] 13.2 [42] 8.6 4.7 93 Dl Sales / Working Capital DI EBIT / Interest 13.- (236) 10.1 24 Il Net Profit - DDA / Curr Mat LTD 7.4 (69) 4.0 1.7 Il Fixed / Worth 3 7 23 lil Debt / Worth .6 0 [19) 19.2 [4483 [28] 13.1 [28] 13.0 [21) 17.5 [39] 9.4 [70] 5.2 [61] 6.0 [49] 75 [38] 9.7 [69] 53 [122] 3.0 [91] 4.0 [114] 3.2 [64] 3.7 [6] 57.6 [15] 247 [16] 23.5 [16] 224 [20] 18.7 [2414.9 [29] 12.7 (24) 15.1 [25) 145 [31] 11.6 [47] 7.8 [39] 93 [39] 93 [43] 8.5 4.7 3.6 4.6 5.6 6.8 8.8 8.6 19.2 13.4 20.5 12.5 28.9 - 17.1 77.9 23.2 43.6 58.4 70.4 (15) 6.1 (50) 16.4 (69) 11.9 (43) 5.4 (55) 10.1 1.5 4.1 2.9 1.3 22 7.9 15.4 4.0 9.6 (10) 3.3 (25) 5.9 (19) 2.0 (13) 4.4 1.9 2.6 1.0 1.8 .1 .1 3 .8 .7 3 .6 1.8 1.3 1.3 9 2.3 17.5 5.2 .8 1.1 1.2 1.2 2.8 2.5 6.1 1.9 74.6 83.5 55.2 61.5 41.6 (19) 23.6 (60) 27.1 (71) 28.9 (36) 20.9 (45) 242 -2.6 13.8 12.1 5.8 10.8 24.3 23.8 20.6 14.7 14.6 12.8 11.8 7.2 8.0 3.5 5 2.1 111.8 41.5 18.7 8.4 8.8 222 10.4 7.8 4.5 5.1 11.3 5.4 2.9 3.5 5.2 2.7 2.7 1.9 2.4 2.9 2.0 2.0 1.5 1.7 23 1.4 1.3 1.3 3 5 1.0 1.8 1.6 (12) 1.1 (52) 1.4 (71) 1.9 (40) 3.2 (33) 2.4 2.4 4.1 4.0 2.7 23 1.3 (10) 3.8 (20) 3.4 (10) 2.2 5.2 73 6.6 100838M 722022M 3840568M 4951316M 18644103M 23498M 328762M 1825560M 3197395M 9269737M 10.9 Il Profit before Taxes / Tangible Net Worth 4.6 522 (236) 25.2 11.4 DI % Profit before Taxes/Total Assets 18.3 9.8 2.5 Il Sales / Net Fixed Assets Il Sales/Total Assets 16.6 7.5 3.9 2.7 1.8 1.3 1.0 (210) 2.1 3.8 2.1 (44) 3.2 Dl Depr, Depli mort/Sale Il % Officers', Directors, Owners' Comp/Sales 5263M Il Net Sales (5) Il Total Assets (5) 28264110M 14646584M 1632M 20xX20XX20XX* Industry Average*** Inventory Turnover (CGS*/Inv.)) Fixed Asset Turnover (Sales/Net PPE) -- Total Asset Turnover (Sales/Total Assets) *use Cost of Goods sold to make the comparison to the industry average more accurate. **most recent year *** list all 3 industry average figures for each ratio 5.) Liquidity Ratios: 2017 2018 2019 Industry Average 12.0 ? ? ? 7.5 Inventory Turnover (CGS/Inv.) 4.0 15.1 ? ? ? 7.0 Fixed Asset Turnover (Sales/Net PPE) 3.9 2.5 ? ? ? 1.8 Total Asset Turnover (Sales/Total Assets) 1.3 Year: 2019-20 Region: National - All Regions Print Export FRB Assets FRB History FRB Sales IDP Assets IDP History IDP Sales 0-500M 500M-2MM 2-10MM 10-50MM 50-100MM 100-250MM All 1 15 11 25 52 30 13 15 1 Type of Statement Il Unqualified Dl Reviewed Il Compiled Tax Returns Il Other 1 1 1 7 1 12 5 10 4 32 46 30 143 25 (4/1-9/30/18) 222 (10/1-3/31/19) 4 15 57 78 36 57 7.6 7.1 7.4 5.3 11.4 23.4 21.0 243 32.0 23.2 15.7 1.8 21.4 24.5 3.0 56.0 30.8 6.0 37.9 1.2 73.9 13.3 6.5 3.3 3.0 53.9 50.2 65.7 255 34.0 33.4 57.6 29.5 6.5 6.6 103 6.4 3.3 5.5 100.0 6.6 7.8 6.1 6.3 100.0 100.0 1000 100.0 100.0 13.3 8.1 8.8 9.3 9.6 4.2 9.1 3.8 2.8 2.3 11.4 15.0 16.6 20.1 14.6 16.1 .1 2 .8 3 Il Number of Statements ASSETS Il Cash & Equivalents Dl Trade Receivables - (net) Il Inventory ll All Other Current Assets Dl Total Current Assets Il Fixed Assets (net) Il Intangibles (net) Dul All Other Non-Current Assets . Total Assets LIABILITIES Il Notes Payable Short Term Il Qur. Mat.-LITID Il Trade Payables Il Income Taxes Payable ll All Other Current Liabilities Il Total Current Liabilities Il Long Term Debt Il Deferred Taxes Il All Other Non-Current Liabilities Il Net Worth Il Total Liabilities & Net Worth INCOME DATA Il Net Sales Il Gross Profit Lil Operating Expenses Lil Operating Profit Dol All Other Expenses (net) Il Profit Before Taxes RATIOS Il Ourrent 3 13.9 12.2 15.7 11.3 3.6 29.2 .1 7.0 33.0 147 3 47.7 41.7 41.4 42.8 15.7 12.8 15.7 20.7 9 .0 .6 .8 .6 2.5 7.6 11.4 7.5 58.3 42.1 33.3 27.3 32.4 34.9 100.0 100.0 100.0 100.0 100.0 100.0 100.0 100.0 100.0 100.0 100.0 43.4 31.1 16.4 15.6 35.3 240 100.0 23.4 17.5 5.9 2.0 13.7 123 19.0 8.1 7.0 2.7 5.2 3.4 1.6 5 1.6 7.6 6.4 3.9 1.1 1.7 3.7 2.5 8.6 2.9 1.7 3.7 2.1 1.4 1.9 2.2 1.4 1.1 1.7 1.2 7 1.7 1.3 1.0 Il Quick 1.1 3.9 1.4 [15] 23.6 [25] 14.5 [40] 9:2 .6 [23] 15.8 [38] 9.7 [53] 6.9 Il Sales / Receivables .8 .6 3 (35) 10.4 [43] 8.4 [54] 6.8 7 5 (32) 11.4 [45] 8.2 [55] 6.6 1.3 .7 5 (31) 11.9 [43] 8.5 [54] 6.7 5 [36] 10.0 [47] 7.8 [60] 6.1 . Cost of Sales/Inventory [25] 14.6 [35) 10.5 [62] 5.9 [21) 173 (31) 11.7 [46] 79 [30) 120 [49] 7.5 [91] 4.0 [20] 17.9 [34) 10.6 [51] 7.2 ul Cost of Sales / Payables Il Sales / Working Capital 11.7 999.8 10.3 EBIT / Interest 2.8 17.3 -28.8 8.0 (55) 2.7 -3 5.7 (18) 2.0 .7 (220) 3.5 .8 Il Net Profit - DDA / Curr Mat LTD 6.8 (65) 2.6 1.1 1.0 Il Fixed / Worth 5 .8 19.3 4 1.0 3.2 7 1.9 Il Debt / Worth 1.1 [44] 83 (32) 11.5 [30) 123 [96] 3.8 [66] 5.5 [53] 6.9 [57] 6.4 [126] 2.9 [114] 3.2 [91] 4.0 [87] 4.2 [4] 1033 [19] 19.7 [22] 16.5 [23] 15.7 [21] 17.8 [34) 10.8 [38] 9.7 [41] 8.9 [51] 7.2 [46] 7.9 [61] 6.0 [55] 6.6 3.3 5.3 8.1 7.5 7.3 11.3 27.7 15.6 101.8 - 11.2 70.1 31.0 122 (13) 11.5 (49) 8.7 (69) 4.7 (31) 1.0 1.8 1.1 -1.3 6.1 6.5 (15) 2.6 (21) 2.9 (11) 2.0 .6 0 5 .1 1.1 1.1 6 1.3 3.3 3.8 .1 1.0 9 2.0 2.6 2.5 2.6 8.0 8.1 1002 443 36.3 30.1 (14) 53.0 (50) 268 (66) 20.0 (31) 5.4 2.8 8.9 3.8 -7.4 38.8 20.7 122 9.1 18.9 11.3 5.3 2.6 2.8 7 1964 26.2 11.5 11.9 9.2 6.2 6.3 15.1 5.6 3.4 2.8 4.5 2.9 2.3 2.0 2.4 2.2 1.7 1.6 2.0 1.6 1.3 1.2 9 1.6 1.7 (51) 23 (74) 2.9 (30) 3.1 4.0 4.9 4.4 2.8 .8 (10) 4.5 (16) 1.8 5.7 3.8 69257M 736132M 3498351M 5105115M 21155M 322273M 1979668M 2534859M Il % Profit before Taxes / Tangible Net Worth 75.8 21.4 (44) 11.1 -6.7 102 3.3 38.1 (207) 18.1 23 Il % Profit before Taxes / Total Assets 5.8 Il Sales / Net Fixed Assets 9.0 6.0 3.8 15.1 7.0 3.9 Il Sales/Total Assets 2.1 1.5 1.3 2.5 1.8 1.3 1.3 (196) 2.4 lol % Depr Depl, Amort / Sales 1.5 (31) 2.0 4.1 Il % Officers', Directors, Owners' Comp/Sales 1.5 (34) 2.8 4.7 lub Net Sales (5) Il Total Assets (5) 4927M 1264M 15777582M 8758058M 25191864M 13617277M Year: 2018-19 Region: National - All Regions Print Export FRB Assets FRB History FRB Sales IDP Assets IDP History IDP Sales 0-500M 500M-2MM 2.10MM 10-50MM 50-100MM 100-250MM All 19 16 21 3 15 59 27 11 1 Type of Statement . Unqualified ul Reviewed Il Compiled Tax Returns Il Other 6 1 14 5 2 3 7 10 22 4 21 33 25 31 122 27 (4/1-9/30/17) 217 (10/1-3/31/18) 7 17 55 70 43 52 15.6 8.7 9.2 24.6 12.1 9.1 18.8 23.7 19.1 20.7 6.2 23.2 143 5.5 20.2 24.6 31.0 13 66.1 4.5 3.3 1.6 78.5 122 3.9 55.0 35.1 50.5 37.6 5.0 57.4 31.5 35.8 2.9 4.0 10.6 5.5 5.4 6.3 5.9 7.0 5.7 100.0 100.0 100.0 100.0 100.0 100.0 6.3 7.9 10.0 9.7 7.2 8.6 1.6 3.8 3.0 2.8 175 .0 3.5 12.7 13.4 13.2 15.3 .1 2. Il Number of Statements ASSETS Il Cash & Equivalents Dl Trade Receivables - (net) Inventory ll All Other Current Assets Il Total Current Assets Il Fixed Assets (net) Il Intangibles (net) Dl All Other Non-Current Assets Il Total Assets LIABILITIES Il Notes Payable-Short Term Il Qur. Mat.-LITID Il Trade Payables .ll Income Taxes Payable ll All Other Current Liabilities DI Total Current Liabilities l Long Term Debt Il Deferred Taxes .ll All Other Non.Current Liabilities Il Net Worth Il Total Liabilities & Net Worth INCOME DATA Il Net Sales Lul Gross Profit all Operating Expenses Lil Operating Profit lol All Other Expenses (net) Il Profit Before Taxes RATIOS Dl Ourrent 13.0 13.0 39.3 10.6 36.8 23.7 34.9 38.7 132 39.7 20.3 1.3 10.8 11.8 15.4 14.8 15.3 .1 5 1.1 .0 1.6 3.9 5.0 5.5 6.2 41.0 63.9 49.4 39.9 33.2 30.7 100.0 100.0 100.0 100.0 100.0 100.0 100.0 100.0 100.0 100.0 48.2 100.0 23.5 100.0 15.8 31.8 17.6 25.0 41.8 23.8 17.9 12.2 12.0 19.3 6.4 8.0 5.6 3.6 5.6 5.7 1.2 1.4 1.0 4.7 7.2 4.6 23 4.3 2.0 1.6 1.1 2.0 1.3 1.0 1.9 1.4 9 2.6 1.6 1.1 Gol Quick 9.1 3.2 3.1 2.0 2.0 1.3 3.1 1.8 1.3 5 .6 [O] UND [27] 13.6 [5] 70.4 [43] 8.5 [26] 13.9 [58] 6.3 1.3 .7 1.1 7 4 1.3 .8 4 5 Il Sales/ Receivables [27] 13.4 [41] 8.8 [57] 6.4 [30] 12.2 [44] 8.3 [58] 6.3 [38] 9.6 [45] 8.1 [56] 6.5 [27] 13.6 [42] 8.6 [55] 6.6 .nl Cost of Sales / Inventory [33] 11.1 [53] 6.9 [23] 15.9 [32] 113 [54] 6.7 (21) 17.1 (32) 11.4 [43] 8.5 Il Cost of Sales / Payables [39] 9.4 [60] 6.1 [111] 33 [19) 193 [28] 13.2 [52] 7.0 4.5 10.3 1222 122 (60) 4.3 9 Il Sales / Working Capital [43] 8.4 [34) 10.6 [99] 3.7 [62] 5.9 [174] 2.1 [146] 2.5 [6] 61.7 [16] 22.4 [14] 26.5 [30] 12.0 [42] 8.7 [58] 6.3 3.8 4.5 6.1 7.2 16.2 15.2 37.7 (11) 28.9 (46) 12.9 2.1 31.7 (12) 12.0 1.8 0 .1 .1 2. 1.0 [18] 19.9 [27] 13.5 [45] 8.1 6.9 14.9 -76.1 20.2 23 4 5.8 14.0 -33.0 [31] 11.3 [52] 7.0 [85] 43 [18] 20.6 [28] 13.2 [45] 8.1 5.2 10.3 45.9 23.5 (216) 5.5 1.1 5.4 (75) 3.1 1.5 I EBIT / Interest 173 2.7 Il Net Profit - DDA / Curr Mat LTD 4.5 (17) 1.8 5 Il Fixed / Worth (23) 2.8 1.2 4 1.1 2.1 7 1.1 3.5 2.2 Dl Debt / Worth 1.2 ini 1.0 5.6 (21) 4.0 1.6 9 1.7 5.3 1.2 2.5 6.8 32.1 (42) 18.4 1.7 12.5 5.6 1.5 5 1.3 1.2 2.5 10.6 .7 1.5 3.9 34.6 (215) 18.0 3.3 Il % Profit before Taxes / Tangible Net Worth 29.3 (63) 13.9 2.9 30.3 (35) 11.7 -1.6 66.7 20.3 (52) 20.9 8.1 10.8 33.8 24.1 123 10.7 3.5 3.7 DI % Profit before Taxes/Total Assets 14.1 5.3 2.6 15.0 6.0 .8 15.6 6.3 3.4 Dl Sales / Net Fixed Assets 755.4 Il Sales / Total Assets 2.5 1.7 13 lol % Depr, Depl, Amort / Sales 8.0 9.1 40.1 5.2 4.1 4.8 18.4 5.2 2.6 2.5 3.2 2.8 2.0 2.0 2.2 3.3 2.1 1.5 1.4 1.6 2.2 1.5 1.1 1.2 1.2 .6 1.6 1.8 1.6 (42) 1.8 (65) 3.2 (41) 4.0 (33) 2.5 3.6 5.7 5.8 3.1 2.1 1.5 (12) 47 (21) 2.4 13.5 85073M 634114M 3216770M 5875096M 14581527M 21019M 293913M 1953139M 3125027M 7919980M 1.5 (195) 2.8 Il % Officers', Directors, Owners' Comp/Sales 1.9 (45) 3.4 6.5 24404392M 13314748M bol Net Sales (5) Il Total Assets (5) 11812M 1670M Year: 2016-17 Region: National - All Regions Print Export FRB Assets FRB History FRB Sales IDP Assets IDP History IDP Sales 0-500M 500M-2MM 2-10MM 10-50MM 50-100MM 100-250MM All 5 16 14 28 16 19 39 Type of Statement Il Unqualified Il Reviewed Il Compiled Tax Returns l Other 1 1 2 2 1 1 4 16 5 7 19 1 12 27 39 28 27 134 32 (4/1-9/30/15) 239 (10/1.3/31/16) 271 6 21 63 78 46 57 124 5.4 149 21.0 7.9 22.5 25.7 7.5 21.7 25.0 31.3 19.1 9.5 21.2 245 29.8 20.9 15.5 5.6 2.6 683 743 18.9 49.0 3.1 48.5 35.0 60.3 28.6 3.7 59.0 28.6 223 34.3 4.7 3.6 4.7 10.8 6.3 5.9 6.0 2.2 100.0 5.9 100.0 7.6 100.0 100.0 100.0 100.0 5.8 8.8 9.0 6.9 3.4 2.4 3.9 2.8 166 7.7 3.2 138 17.2 13.2 13.5 10.6 .1 .1 3 4 .1 Il Number of Statements ASSETS Il Cash & Equivalents .D Trade Receivables - (net) l Inventory U All Other Current Assets Il Total Current Assets Il Fixed Assets (net) Il Intangibles (net) ll All Other Non-Current Assets Il Total Assets LIABILITIES Il Notes Payable-Short Term Dl Our. Mat.-L/TID Il Trade Payables Il Income Taxes Payable Il All Other Current Liabilities DI Total Current Liabilities Long Term Debt Dl Deferred Taxes ll All Other Non-Current Liabilities Il Net Worth Dl Total Liabilities & Net Worth INCOME DATA Il Net Sales Il Gross Profit Lil Operating Expenses Dl Operating Profit lol All Other Expenses (net) Il Profit Before Texes RATIOS Il Current 8.0 105 10.2 32.6 10.5 36.9 36.1 35.4 38.3 11.0 35.8 14.2 14.5 14.2 17.2 16.5 4 10.0 .0 3.6 1.0 1.9 7.6 11.0 6.6 42.5 53.8 44.5 100.0 32.4 100.0 37.9 100.0 100.0 100.0 100.0 100.0 100.0 100.0 100.0 100.0 36.9 100.0 19.8 39.6 23.0 19.2 26.7 34.8 27.2 15.6 13.8 12.8 19.4 7.3 9.7 7.4 6.0 3 7 1.2 7 9.8 6.8 4.8 5.0 6.6 2.9 2.0 1.2 2.3 1.3 1.8 1.4 1.1 2.9 1.7 1.1 1.3 .8 Il Quick 1.3 3.5 3.8 2.4 2.3 1.5 1.3 2.0 2.2 1.0 1.0 5 [9] 40.3 [21] 17.0 (31) 11.7 [40] 9.2 [54] 6.8 [47] 7.7 1.0 .6 [32] 113 [39] 9.4 [51] 7.2 Il Sales/Receivables 1.0 7 5 [29] 12.5 [45] 8.2 [59] 6.2 7 (33) 11.0 [42] 8.6 [51] 7.1 (28) 13.0 [40] 9.2 [51] 7.2 .nl Cost of Sales / Inventory Del Cost of Sales / Payables [28] 13.2 [52] 7.0 [94] 3.9 [16) 22.4 [28] 13.2 [42] 8.6 4.7 93 Dl Sales / Working Capital DI EBIT / Interest 13.- (236) 10.1 24 Il Net Profit - DDA / Curr Mat LTD 7.4 (69) 4.0 1.7 Il Fixed / Worth 3 7 23 lil Debt / Worth .6 0 [19) 19.2 [4483 [28] 13.1 [28] 13.0 [21) 17.5 [39] 9.4 [70] 5.2 [61] 6.0 [49] 75 [38] 9.7 [69] 53 [122] 3.0 [91] 4.0 [114] 3.2 [64] 3.7 [6] 57.6 [15] 247 [16] 23.5 [16] 224 [20] 18.7 [2414.9 [29] 12.7 (24) 15.1 [25) 145 [31] 11.6 [47] 7.8 [39] 93 [39] 93 [43] 8.5 4.7 3.6 4.6 5.6 6.8 8.8 8.6 19.2 13.4 20.5 12.5 28.9 - 17.1 77.9 23.2 43.6 58.4 70.4 (15) 6.1 (50) 16.4 (69) 11.9 (43) 5.4 (55) 10.1 1.5 4.1 2.9 1.3 22 7.9 15.4 4.0 9.6 (10) 3.3 (25) 5.9 (19) 2.0 (13) 4.4 1.9 2.6 1.0 1.8 .1 .1 3 .8 .7 3 .6 1.8 1.3 1.3 9 2.3 17.5 5.2 .8 1.1 1.2 1.2 2.8 2.5 6.1 1.9 74.6 83.5 55.2 61.5 41.6 (19) 23.6 (60) 27.1 (71) 28.9 (36) 20.9 (45) 242 -2.6 13.8 12.1 5.8 10.8 24.3 23.8 20.6 14.7 14.6 12.8 11.8 7.2 8.0 3.5 5 2.1 111.8 41.5 18.7 8.4 8.8 222 10.4 7.8 4.5 5.1 11.3 5.4 2.9 3.5 5.2 2.7 2.7 1.9 2.4 2.9 2.0 2.0 1.5 1.7 23 1.4 1.3 1.3 3 5 1.0 1.8 1.6 (12) 1.1 (52) 1.4 (71) 1.9 (40) 3.2 (33) 2.4 2.4 4.1 4.0 2.7 23 1.3 (10) 3.8 (20) 3.4 (10) 2.2 5.2 73 6.6 100838M 722022M 3840568M 4951316M 18644103M 23498M 328762M 1825560M 3197395M 9269737M 10.9 Il Profit before Taxes / Tangible Net Worth 4.6 522 (236) 25.2 11.4 DI % Profit before Taxes/Total Assets 18.3 9.8 2.5 Il Sales / Net Fixed Assets Il Sales/Total Assets 16.6 7.5 3.9 2.7 1.8 1.3 1.0 (210) 2.1 3.8 2.1 (44) 3.2 Dl Depr, Depli mort/Sale Il % Officers', Directors, Owners' Comp/Sales 5263M Il Net Sales (5) Il Total Assets (5) 28264110M 14646584M 1632M