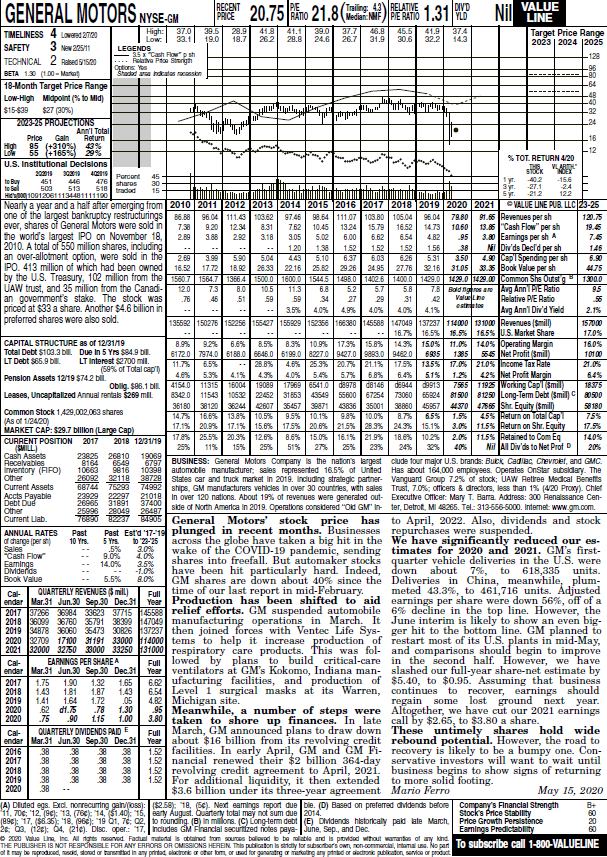
GENERAL MOTORS NYSE-CM Nil 46.9 + 16 - 12 + { TES NEX Parcant 476 shares 513 -27.1 E E 10100 RECENT Trailing 43 RELATIVE DIVD VALUE PRICE LINE TIMELINESS 4 Low 9720 High: 37.0 39.5 28.9 41.8 41.1 39.0 37.7 45.5 41.9 37.4 Low: 33.1 19.0 18.7 26.2 29.8 24.6 Target Price Range 26.7 31.9 30.6 32.2 14.3 SAFETY 3 New 2011 LEGENDS 2023 2024 2025 35 x Cash Flowsh TECHNICAL 2 Rased 1520 -- Relative Pro Singh 128 Options Yes BETA 1.50 (10-Maria -98 Shaded are con 90 18-Month Target Price Range -64 Low-High Midpoint (% to Mid) 49 -40 $15-$29 $27 (30%) UT -32 2023-25 PROJECTIONS _24 Ann'l Total Price Gain Return (+310%) 43% (+165% U.S. Institutional Decisions % TOT. RETURN 4/20 VLARI 220019 STOCK 45 to Buy 451 446 30 - -15.6 503 518 traded 15 Syr. H5000 100120811134481111190 Sy Nearly a year and a half after emerging from 2010 2011 2012 2013 2014 2015 2016 2017 2018 2019 2020 2021 VALUE UNE PUB LLC 23-25 one of the largest bankruptcy restructurings 86.58 96.04 111.43 103.62 97.46 98.64 111.07 103 80 105.04 96.04 79.80 91.86 Revenues per sh 120.75 ever, shares of General Motors were sold in 7.58 9.20 1234 8.51 7.62 10.45 13.24 15.79 16.52 14.73 10.60 13.85 Cash Flow" per sh 19.45 the world's largest IPO on November 18, 2.89 9.88 2.92 3.18 3.05 5.02 6.00 6.62 6.54 4.82 95 3.80 Earnings per shA 7.45 2010. A total of 550 million shares, including 120 1.38 1.52 1.52 1.52 1.56 Ni Divds Decl'd per sh 145 an over-allotment option, were sold in the 2.68 3.99 5.04 4.43 5.10 6.57 6.03 6.26 531 350 4.00 Cap' Spending per sh 6.90 IPO. 413 million of which had been owned 16.52 17.72 18.92 28.33 22.16 25.2 2928 24.95 27.78 32.16 31.05 33.38 Book Value per sh 44.75 by the U.S. Treasury, 102 million from the 1560 1564.7 1366.4 15000 15000 1544.5 1498.0 14.2.6 100.0 129.0 1420.0 42.00 Common Shs Outsta 13000 UAW trust, and 35 million from the Canadi- 7.3 8.0 10.5 113 6.8 5.2 5.7 5.B 7.8 Bold grane Avg Ann IPE Ratio 95 an government's stake. The stock was .78 46 .51 59 59 34 27 29 S1 Valne Relative PIE Ratio priced at $33 a share. Another $4.6 billion in 3.5% 4.0% 4.9% 4.0% 4.1% Avg Ann'l Div'd Yield preferred shares were also sold. 135592 15027815225615507 155929152356 166380145588 147049137237114000 131000 Revenues Semill) 157000 16.7% 16.5% 16.5% 16.5$ U.S. Market Share 170% CAPITAL STRUCTURE as of 12/31/19 8.9% 9.2% 6.6% 8.5% 8.3% 10.9% 17.3% 15% 14 150% 11.05 140% Operating Margin 16.0% Total Debt $102.3. Due in 5 yrs $84.9 bil. 6172079740616806646.06199.0 8227.09-27.09888.0 94820 LT Debt $85.9 b. LT Interest $2700 mil 6235 1385 5565 Net Profit Smil) 11.7% 6.5% 28.8% 4.8% 25.3% 20.7% 21.1% 17.5% 135% (58% of Total capi) 17.6% 210% Income Tax Rate 21.0% Pension Assets 12/19 $742 bli. 4.6% 5.3% 4.1% 4.9% 4.0% 5.4% 5.7% 6.8% 6.4% 51% 42% Net Proft Marcin 64% Oblig. $96.1 DIE 4154011315 1600419089 17989 6541.00897808146 0894469913 79651193 Working CapilSmil) 18375 Leases, Uncapitalized Annual rentals $260 mil. 83420 11543 10532 22452 31553 43549 556006725473060 65924 8150081250 Long-Term Debt (Smil) 20500 36180 38120 36244 22607 3545739871 Common Stock 1,429,002,063 shares 3836 35001 38860 45957 4450 4565 Shr. Equity (Smil 58180 As of 1/24/20) 14.7% 16.6% 13.8% 10.5% 9.5% 10.1% 9.8% 100% 8.78 65% 1.5% 45% Heturn on ota Cap 75% MARKET CAP: $29.7 billionLarge Cap) 17.1% 20.99 17.1% 15.6% 17.5% 20.8% 21.5% 23% 24.3% 15.1% 3.0% 1158 Return on Shr. Equity 17.5% CURRENT POSITION 2017 17.8% 25.5% 2018 12/31/19 1.6% 150 16.1% 21.9% 186 10.2% 2.0 1155 Retained to Com Eq 14.0% SMILL 11% 15% 25% 51% 27% 23% 24% 92% 40% NIT All Div'ds to Net Prof D 20% Cash Assets 23825 26819 19069 Receivables 8164 6649 6797 BUSINESS: General Motors Company is the nation's largest clude four major U.S. brands: Buick Cadilac Chevrolet, and GMC. Inventory (FFO) 10663 9818 10398 automobile manufacturer: sales represented 16.5% of United Has about 184,000 employees. Operates OnStar subsidiary. The Other 26092 32118 39728 States car and truck market in 2018. Including strategic partner- Vanguard Group 72% of stock; LAW Retiree Medical Benefits Current Assets 68744 78293 74992 ships. GM manufacturers vehicles in over 30 countries, with sales Trusi, 70% officers & directors, less than 1% (4/20 Proxy). Chief Accts Payable 22929 22297 21018 in over 120 nations. About 19% of revenues were generated out- Executive Officer: Mary T. Barra. Address: 300 Renaissance Cen- Debt Due 26965 31891 37400 Other 25996 28049 25487 side of North America in 2019. Operations considered "Old GM'ter, Detroit, MI 48266. Tel: 313-556-5000. Internet: www.gm.com. Current Lab 76890 82237 64905 General Motors' stock price has to April, 2022. Also, dividends and stock ANNUAL RATES Past Past Est'd 17-18 plunged in recent months. Businesses repurchases were suspended. of charge per 10 Yrs. 5 Yrs. to 23-25 across the globe have taken a big hit in the We have significantly reduced our es- .5% 2.0% *Cash Flow 9.0% wake of the COVID-19 pandemic, sending timates for 2020 and 2021. GM's first- Eamings 14.0% 3.5% shares into freefall. But automaker stocks quarter vehicle deliveries in the U.S. were DMderlds -1.0% have been hit particularly hard. Indeed, down about 7%, to 618,335 units. Book Value 5.5% 8.0% GM shares are down about 40% since the Deliveries in China, meanwhile, plum- QUARTERLY REVENUES$ mill) Full time of our last report in mid-February. meted 43.3%, to 461,716 units. Adjusted endar Mar 31 Jun.30 Sep.30 Dec 31 Year Production has been shifted to aid earnings per share were down 56%, off of a 2017 37266 36.4 33823 37715 45588 relief efforts. GM suspended automobile 6% decline in the top line. However, the 2018 36099 35760 35781 38399 47049 manufacturing operations in March. It June interim is likely to show an even big- 2019 34878 3060 35473 30826 137237 then joined forces with Ventec Life Sys- ger hit to the bottom line. GM planned to 2020 2709 17100 31191 33000 14000 tems to help it increase production of restart most of its U.S. plants in mid-May, 2021 32000 32750 33000 33250 131000 respiratory care products. This was fol- and comparisons should begin to improve Cal EARNINGS PER SHARE A Full lowed by plans to build critical care in the second half. However, we have endar Mar 31 Jun 30 Sep 30 Dec.31 Year ventilators at GM's Kokomo, Indiana man- slashed our full-year share-net estimate by 2017 1.75 1.90 1.32 1.65 6.62 ufacturing facilities, and production of $5.40, to $0.95. Assuming that business 2018 1.43 1.81 1.87 1.43 6.54 Level 1 surgical masks at its Warren, continues to recover, earnings should 2019 1.41 1.64 1.72 .05 4.B2 Michigan site. regain some lost ground next year. 2020 .62 dl.75 .78 1.30 195Meanwhile, a number of steps were Altogether, we have cut our 2021 earnings 2020 .75 .90 1.15 1.00 3.80 taken to shore up finances. In late call by $2.65, to $3.80 a share. Cal QUARTERLY DIMIDENDS PAIDE Full March, GM announced plans to draw down These untimely shares hold wide endar Mar 31 Jun 30 Sep 30 Dec.31 Year about $16 billion from its revolving credit rebound potential. However, the road to 2016 38 38 1.52 facilities. In early April, GM and GM Fi- recovery is likely to be a bumpy one. Con- 2017 38 38 1.52 nancial renewed their $2 billion 364-day servative investors will want to wait until 2018 38 38 1.52 revolving credit agreement to April, 2021. business begins to show signs of returning 2019 38 38 1.52 For additional liquidity, it then extended to more solid footing. 2020 38 $3.6 billion under its three-year agreement Mario Ferro May 15, 2020 A) Dluded gs. Brdi, nonrecurring gaboss) 2.58: 18,5). Nerd earnings report due ble. (D) Based on preferred duidends before Company's Financial Strength Stock's Price Stability (896): 17. ($835 18.96): 1961,7 020 rounding in malons. (C) Long-term debt E) Dividends historically paid late March. Price Growth Persistence 24:03. (12): 64. (214). Disc. oper.: 17 Includes GM Financial securized Votes pay-June. Sep., and Dec. Earnings Predictability THE PUBLISHER IS NOT RESPONSIBLE FOR ANY ERRORS OR OMISSIONS HEREN. This publication is silly for subbers , non-commercial, intamal tee. No part to subscribe call 1-800-VALUELINE oft may be reproduced, sod, stored or transmitted in any printed bloctronic or other form, or red for generating or enganyard or otronic publication service or product Sales B+ 20 60 Essential Resource: The Value Line Research Center . Using the Stafford Library website, select the Databases option from the tabbed menu Select Business, Management and Finance Databases from the category options. Select the Value Line Research Center Enter the stock's ticker symbol in the search box located in the upper-right of the screen Click on Quote from the hidden menu and browse the pages that follow Scroll to the bottom of the page to view the most recent Value Line Company Report Report Headings 1. Name of Company and Ticker Symbol: Company name, ticker symbol 2. 10-K Report: Paste the direct URL to the company's most recent 10-K Report (1 point) 3. Company Website: Paste the URL to the company's website (1 point) 4. Value Line's Per Share Financial Data: Report the data for each of the last 3 years for which year-end data is available. In other words, stop just short of the Value Line column containing estimated data. The final year of data will be listed in the third column. See the Sample Value Line document in this week's module to find the data. Format the data using the example below. 5. Value Line's Annual Rates of Change: See the Sample Value Line document to find the data. Format the data using the example below. Value Line Per Share Financial Data 201220132014 Average Annual Price/Earnings Ratio -- Earnings per Share Dividends per Share Cash Flow per Share Value Line Annual Rates of Change Last 10 Years Last 5 yearsNext 5 Years Annual Rate of Change in Sales Annual Rate of Change in Earnings -- Annual Rate of Change in Dividends-- 6. Top 5 Risks: Review Item 1A in the 10-K report to identify and discuss what you consider to be the company's top 5 risks. Try to select risks that are unique to the company's industry rather than selecting risks that affect all businesses, to some degree or another. 7. Evaluation: Using the information you've collected, comment on what you have learned about the company this week. Identify and discuss any strengths and/or concerns. GENERAL MOTORS NYSE-CM Nil 46.9 + 16 - 12 + { TES NEX Parcant 476 shares 513 -27.1 E E 10100 RECENT Trailing 43 RELATIVE DIVD VALUE PRICE LINE TIMELINESS 4 Low 9720 High: 37.0 39.5 28.9 41.8 41.1 39.0 37.7 45.5 41.9 37.4 Low: 33.1 19.0 18.7 26.2 29.8 24.6 Target Price Range 26.7 31.9 30.6 32.2 14.3 SAFETY 3 New 2011 LEGENDS 2023 2024 2025 35 x Cash Flowsh TECHNICAL 2 Rased 1520 -- Relative Pro Singh 128 Options Yes BETA 1.50 (10-Maria -98 Shaded are con 90 18-Month Target Price Range -64 Low-High Midpoint (% to Mid) 49 -40 $15-$29 $27 (30%) UT -32 2023-25 PROJECTIONS _24 Ann'l Total Price Gain Return (+310%) 43% (+165% U.S. Institutional Decisions % TOT. RETURN 4/20 VLARI 220019 STOCK 45 to Buy 451 446 30 - -15.6 503 518 traded 15 Syr. H5000 100120811134481111190 Sy Nearly a year and a half after emerging from 2010 2011 2012 2013 2014 2015 2016 2017 2018 2019 2020 2021 VALUE UNE PUB LLC 23-25 one of the largest bankruptcy restructurings 86.58 96.04 111.43 103.62 97.46 98.64 111.07 103 80 105.04 96.04 79.80 91.86 Revenues per sh 120.75 ever, shares of General Motors were sold in 7.58 9.20 1234 8.51 7.62 10.45 13.24 15.79 16.52 14.73 10.60 13.85 Cash Flow" per sh 19.45 the world's largest IPO on November 18, 2.89 9.88 2.92 3.18 3.05 5.02 6.00 6.62 6.54 4.82 95 3.80 Earnings per shA 7.45 2010. A total of 550 million shares, including 120 1.38 1.52 1.52 1.52 1.56 Ni Divds Decl'd per sh 145 an over-allotment option, were sold in the 2.68 3.99 5.04 4.43 5.10 6.57 6.03 6.26 531 350 4.00 Cap' Spending per sh 6.90 IPO. 413 million of which had been owned 16.52 17.72 18.92 28.33 22.16 25.2 2928 24.95 27.78 32.16 31.05 33.38 Book Value per sh 44.75 by the U.S. Treasury, 102 million from the 1560 1564.7 1366.4 15000 15000 1544.5 1498.0 14.2.6 100.0 129.0 1420.0 42.00 Common Shs Outsta 13000 UAW trust, and 35 million from the Canadi- 7.3 8.0 10.5 113 6.8 5.2 5.7 5.B 7.8 Bold grane Avg Ann IPE Ratio 95 an government's stake. The stock was .78 46 .51 59 59 34 27 29 S1 Valne Relative PIE Ratio priced at $33 a share. Another $4.6 billion in 3.5% 4.0% 4.9% 4.0% 4.1% Avg Ann'l Div'd Yield preferred shares were also sold. 135592 15027815225615507 155929152356 166380145588 147049137237114000 131000 Revenues Semill) 157000 16.7% 16.5% 16.5% 16.5$ U.S. Market Share 170% CAPITAL STRUCTURE as of 12/31/19 8.9% 9.2% 6.6% 8.5% 8.3% 10.9% 17.3% 15% 14 150% 11.05 140% Operating Margin 16.0% Total Debt $102.3. Due in 5 yrs $84.9 bil. 6172079740616806646.06199.0 8227.09-27.09888.0 94820 LT Debt $85.9 b. LT Interest $2700 mil 6235 1385 5565 Net Profit Smil) 11.7% 6.5% 28.8% 4.8% 25.3% 20.7% 21.1% 17.5% 135% (58% of Total capi) 17.6% 210% Income Tax Rate 21.0% Pension Assets 12/19 $742 bli. 4.6% 5.3% 4.1% 4.9% 4.0% 5.4% 5.7% 6.8% 6.4% 51% 42% Net Proft Marcin 64% Oblig. $96.1 DIE 4154011315 1600419089 17989 6541.00897808146 0894469913 79651193 Working CapilSmil) 18375 Leases, Uncapitalized Annual rentals $260 mil. 83420 11543 10532 22452 31553 43549 556006725473060 65924 8150081250 Long-Term Debt (Smil) 20500 36180 38120 36244 22607 3545739871 Common Stock 1,429,002,063 shares 3836 35001 38860 45957 4450 4565 Shr. Equity (Smil 58180 As of 1/24/20) 14.7% 16.6% 13.8% 10.5% 9.5% 10.1% 9.8% 100% 8.78 65% 1.5% 45% Heturn on ota Cap 75% MARKET CAP: $29.7 billionLarge Cap) 17.1% 20.99 17.1% 15.6% 17.5% 20.8% 21.5% 23% 24.3% 15.1% 3.0% 1158 Return on Shr. Equity 17.5% CURRENT POSITION 2017 17.8% 25.5% 2018 12/31/19 1.6% 150 16.1% 21.9% 186 10.2% 2.0 1155 Retained to Com Eq 14.0% SMILL 11% 15% 25% 51% 27% 23% 24% 92% 40% NIT All Div'ds to Net Prof D 20% Cash Assets 23825 26819 19069 Receivables 8164 6649 6797 BUSINESS: General Motors Company is the nation's largest clude four major U.S. brands: Buick Cadilac Chevrolet, and GMC. Inventory (FFO) 10663 9818 10398 automobile manufacturer: sales represented 16.5% of United Has about 184,000 employees. Operates OnStar subsidiary. The Other 26092 32118 39728 States car and truck market in 2018. Including strategic partner- Vanguard Group 72% of stock; LAW Retiree Medical Benefits Current Assets 68744 78293 74992 ships. GM manufacturers vehicles in over 30 countries, with sales Trusi, 70% officers & directors, less than 1% (4/20 Proxy). Chief Accts Payable 22929 22297 21018 in over 120 nations. About 19% of revenues were generated out- Executive Officer: Mary T. Barra. Address: 300 Renaissance Cen- Debt Due 26965 31891 37400 Other 25996 28049 25487 side of North America in 2019. Operations considered "Old GM'ter, Detroit, MI 48266. Tel: 313-556-5000. Internet: www.gm.com. Current Lab 76890 82237 64905 General Motors' stock price has to April, 2022. Also, dividends and stock ANNUAL RATES Past Past Est'd 17-18 plunged in recent months. Businesses repurchases were suspended. of charge per 10 Yrs. 5 Yrs. to 23-25 across the globe have taken a big hit in the We have significantly reduced our es- .5% 2.0% *Cash Flow 9.0% wake of the COVID-19 pandemic, sending timates for 2020 and 2021. GM's first- Eamings 14.0% 3.5% shares into freefall. But automaker stocks quarter vehicle deliveries in the U.S. were DMderlds -1.0% have been hit particularly hard. Indeed, down about 7%, to 618,335 units. Book Value 5.5% 8.0% GM shares are down about 40% since the Deliveries in China, meanwhile, plum- QUARTERLY REVENUES$ mill) Full time of our last report in mid-February. meted 43.3%, to 461,716 units. Adjusted endar Mar 31 Jun.30 Sep.30 Dec 31 Year Production has been shifted to aid earnings per share were down 56%, off of a 2017 37266 36.4 33823 37715 45588 relief efforts. GM suspended automobile 6% decline in the top line. However, the 2018 36099 35760 35781 38399 47049 manufacturing operations in March. It June interim is likely to show an even big- 2019 34878 3060 35473 30826 137237 then joined forces with Ventec Life Sys- ger hit to the bottom line. GM planned to 2020 2709 17100 31191 33000 14000 tems to help it increase production of restart most of its U.S. plants in mid-May, 2021 32000 32750 33000 33250 131000 respiratory care products. This was fol- and comparisons should begin to improve Cal EARNINGS PER SHARE A Full lowed by plans to build critical care in the second half. However, we have endar Mar 31 Jun 30 Sep 30 Dec.31 Year ventilators at GM's Kokomo, Indiana man- slashed our full-year share-net estimate by 2017 1.75 1.90 1.32 1.65 6.62 ufacturing facilities, and production of $5.40, to $0.95. Assuming that business 2018 1.43 1.81 1.87 1.43 6.54 Level 1 surgical masks at its Warren, continues to recover, earnings should 2019 1.41 1.64 1.72 .05 4.B2 Michigan site. regain some lost ground next year. 2020 .62 dl.75 .78 1.30 195Meanwhile, a number of steps were Altogether, we have cut our 2021 earnings 2020 .75 .90 1.15 1.00 3.80 taken to shore up finances. In late call by $2.65, to $3.80 a share. Cal QUARTERLY DIMIDENDS PAIDE Full March, GM announced plans to draw down These untimely shares hold wide endar Mar 31 Jun 30 Sep 30 Dec.31 Year about $16 billion from its revolving credit rebound potential. However, the road to 2016 38 38 1.52 facilities. In early April, GM and GM Fi- recovery is likely to be a bumpy one. Con- 2017 38 38 1.52 nancial renewed their $2 billion 364-day servative investors will want to wait until 2018 38 38 1.52 revolving credit agreement to April, 2021. business begins to show signs of returning 2019 38 38 1.52 For additional liquidity, it then extended to more solid footing. 2020 38 $3.6 billion under its three-year agreement Mario Ferro May 15, 2020 A) Dluded gs. Brdi, nonrecurring gaboss) 2.58: 18,5). Nerd earnings report due ble. (D) Based on preferred duidends before Company's Financial Strength Stock's Price Stability (896): 17. ($835 18.96): 1961,7 020 rounding in malons. (C) Long-term debt E) Dividends historically paid late March. Price Growth Persistence 24:03. (12): 64. (214). Disc. oper.: 17 Includes GM Financial securized Votes pay-June. Sep., and Dec. Earnings Predictability THE PUBLISHER IS NOT RESPONSIBLE FOR ANY ERRORS OR OMISSIONS HEREN. This publication is silly for subbers , non-commercial, intamal tee. No part to subscribe call 1-800-VALUELINE oft may be reproduced, sod, stored or transmitted in any printed bloctronic or other form, or red for generating or enganyard or otronic publication service or product Sales B+ 20 60 Essential Resource: The Value Line Research Center . Using the Stafford Library website, select the Databases option from the tabbed menu Select Business, Management and Finance Databases from the category options. Select the Value Line Research Center Enter the stock's ticker symbol in the search box located in the upper-right of the screen Click on Quote from the hidden menu and browse the pages that follow Scroll to the bottom of the page to view the most recent Value Line Company Report Report Headings 1. Name of Company and Ticker Symbol: Company name, ticker symbol 2. 10-K Report: Paste the direct URL to the company's most recent 10-K Report (1 point) 3. Company Website: Paste the URL to the company's website (1 point) 4. Value Line's Per Share Financial Data: Report the data for each of the last 3 years for which year-end data is available. In other words, stop just short of the Value Line column containing estimated data. The final year of data will be listed in the third column. See the Sample Value Line document in this week's module to find the data. Format the data using the example below. 5. Value Line's Annual Rates of Change: See the Sample Value Line document to find the data. Format the data using the example below. Value Line Per Share Financial Data 201220132014 Average Annual Price/Earnings Ratio -- Earnings per Share Dividends per Share Cash Flow per Share Value Line Annual Rates of Change Last 10 Years Last 5 yearsNext 5 Years Annual Rate of Change in Sales Annual Rate of Change in Earnings -- Annual Rate of Change in Dividends-- 6. Top 5 Risks: Review Item 1A in the 10-K report to identify and discuss what you consider to be the company's top 5 risks. Try to select risks that are unique to the company's industry rather than selecting risks that affect all businesses, to some degree or another. 7. Evaluation: Using the information you've collected, comment on what you have learned about the company this week. Identify and discuss any strengths and/or concerns