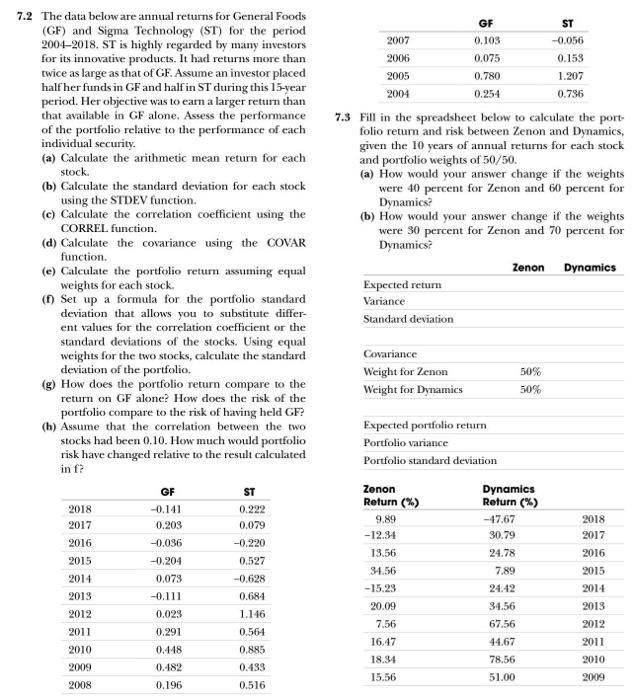
GF ST 2007 0.103 -0,056 2006 0.075 0.153 2005 0.780 1.207 2004 0.254 0.736 7.3 Fill in the spreadsheet below to calculate the port folio return and risk between Zenon and Dynamics, given the 10 years of annual returns for each stock and portfolio weights of 50/50. (a) How would your answer change if the weights were 40 percent for Zenon and 60 percent for Dynamics? (b) How would your answer change if the weights were 30 percent for Zenon and 70 percent for Dynamics? Zenon Dynamics Expected return Variance Standard deviation 7.2 The data below are annual returns for General Foods (GF) and Sigma Technology (ST) for the period 20042018. ST is highly regarded by many investors for its innovative products. It had returns more than twice as large as that of GF. Assume an investor placed half her funds in GF and half in ST during this 15-year period. Her objective was to earn a larger return than that available in GF alone. Assess the performance of the portfolio relative to the performance of cach individual security. (a) Calculate the arithmetic mean return for each stock (b) Calculate the standard deviation for each stock using the STDEV function. (c) Calculate the correlation coefficient using the CORREL function. (d) Calculate the covariance using the COVAR function (e) Calculate the portfolio return assuming equal weights for each stock. (1) Set up a formula for the portfolio Standard deviation that allows you to substitute differ- ent values for the correlation coefficient or the standard deviations of the stocks. Using equal weights for the two stocks, calculate the standard deviation of the portfolio (g) How does the portfolio return compare to the return on GF alone? How does the risk of the portfolio compare to the risk of having held GF? (h) Assume that the correlation between the two stocks had been 0.10. How much would portfolio risk have changed relative to the result calculated in f? GF ST 2018 -0,141 0.222 0.203 0,079 2016 -0.036 -0.220 2015 -0.204 0.527 2014 0.073 -0.628 2013 -0.111 0.684 2012 0.023 1.146 2011 0.291 0.564 2010 0.448 0.885 2009 0.182 0.433 2008 0.196 0.516 Covariance Weight for Zenon Weight for Dynamics 50% 50% 2017 Expected portfolio return Portfolio variance Portfolio standard deviation Zenon Dynamics Return (%) Return (%) 9.89 - 47.67 -12.34 30.79 13.56 24.78 34.56 7.89 -15.23 24.42 20.09 34.56 7.56 67.56 16.47 44.67 18.94 78.56 15.56 51.00 2018 2017 2016 2015 2014 2013 2012 2011 2010 2009