Answered step by step
Verified Expert Solution
Link Copied!

Question

1 Approved Answer

GIVE TYPED WRITING SO I CAN UNDERSTAND CLEARLY. IF YOU CANNOT TYPE,PLEASE PROVIDE NEAT AND CLEAR HANDWRITING.DO NOT GIVE BLUR AND CLUMSY WRITING.IT IS HARD

GIVE TYPED WRITING SO I CAN UNDERSTAND CLEARLY.

IF YOU CANNOT TYPE,PLEASE PROVIDE NEAT AND CLEAR HANDWRITING.DO NOT GIVE BLUR AND CLUMSY WRITING.IT IS HARD FOR ME TO UNDERSTAND.

Kindly give accurate and correct answers.Kindly give step by step working.Do not skip steps. Mention and be very clear about the formula and conversion

.Then,explain to support and prove the working and answers.I do not really understand.I hope you can help me to understand.Explain how you get the answers and about each working.

3)
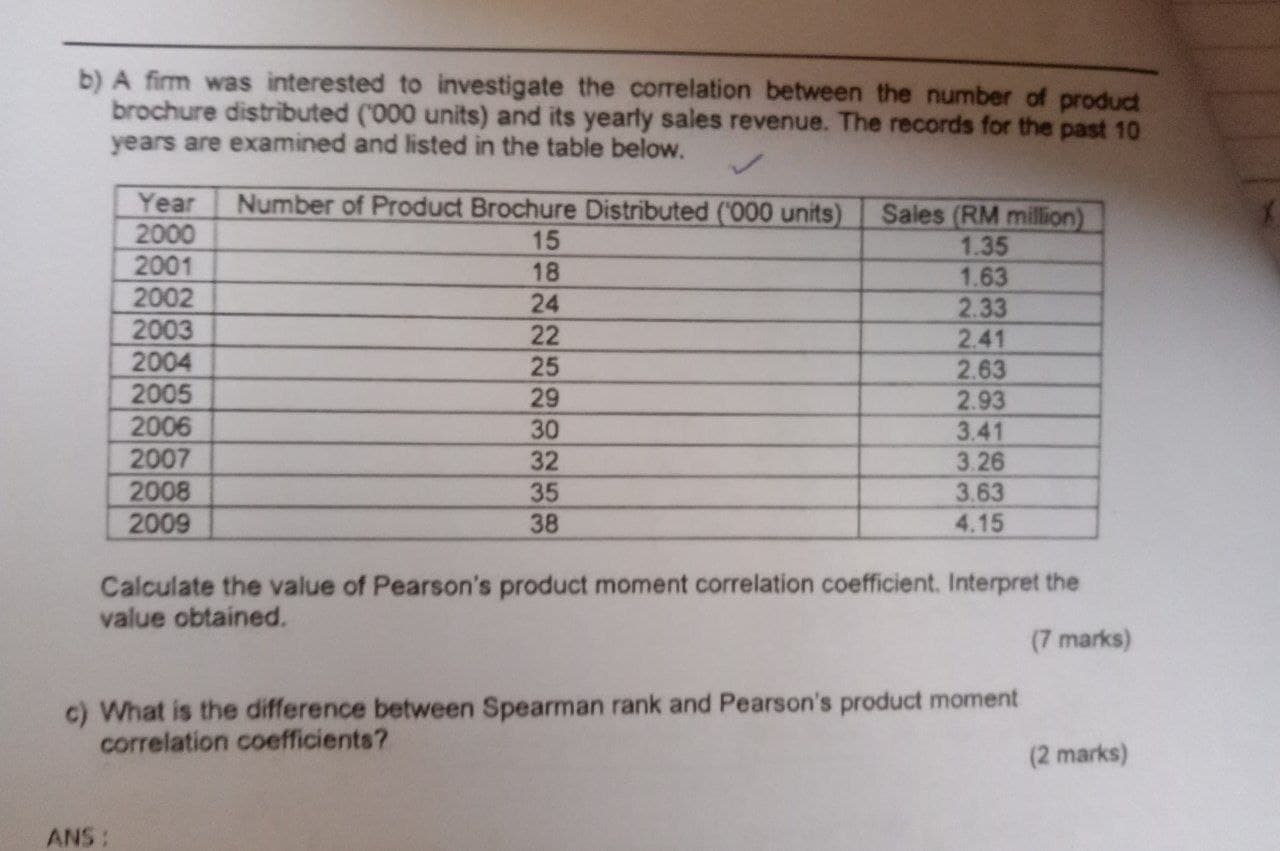
image text in transcribedimage text in transcribedimage text in transcribed
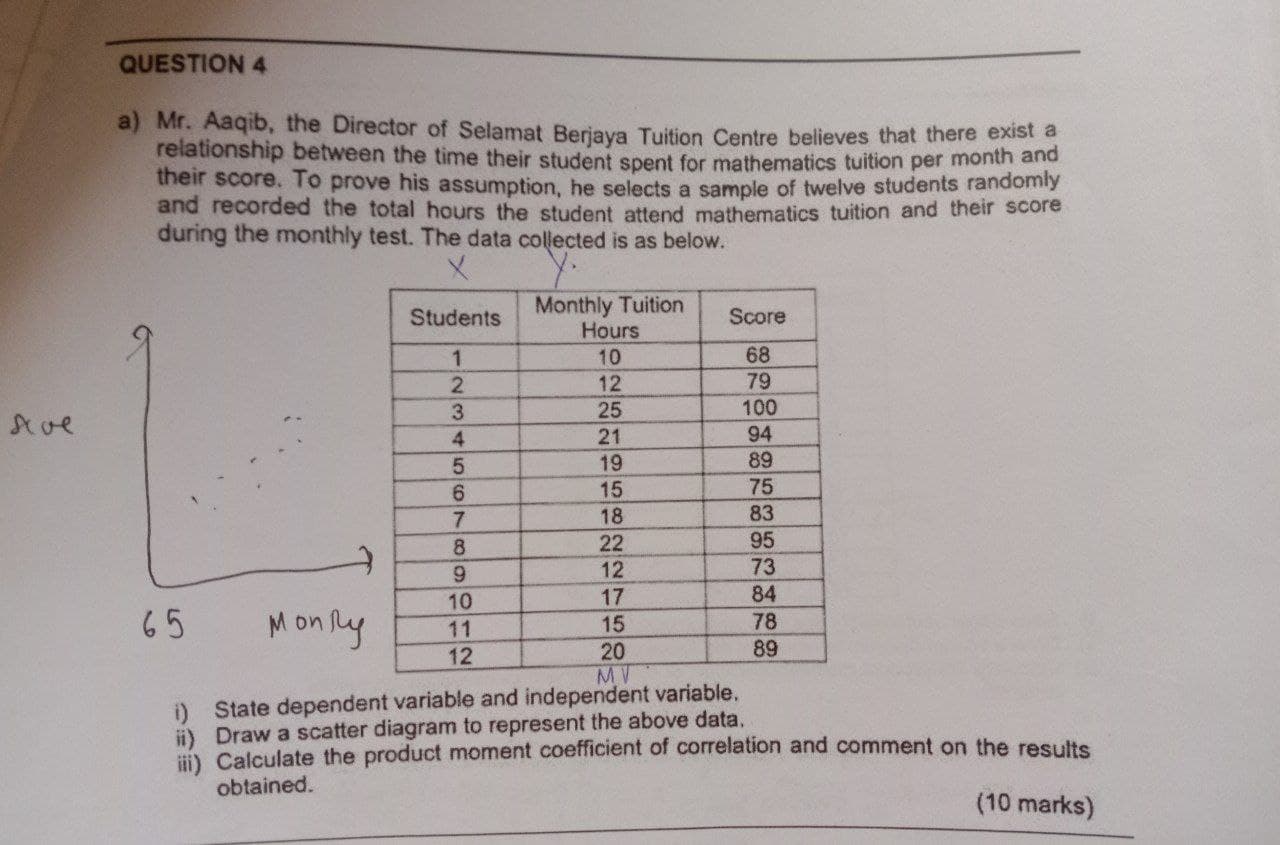
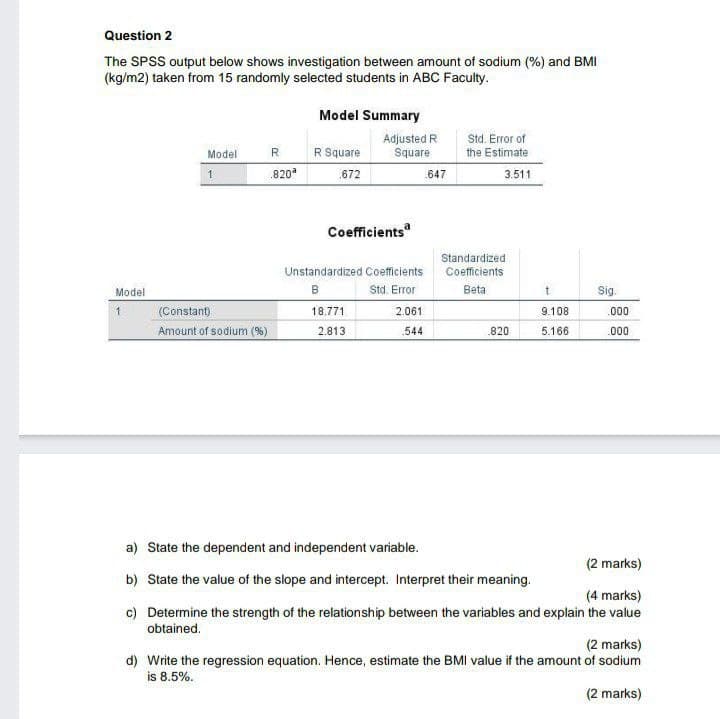
b) A firm was interested to investigate the correlation between the number of product brochure distributed ('000 units) and its yearly sales revenue. The records for the past 10 years are examined and listed in the table below. Year Number of Product Brochure Distributed ('000 units) 2000 Sales (RM million) 15 2001 1.35 18 2002 1.63 24 2003 2.33 22 2.41 2004 25 2.63 2005 29 2.93 2006 30 3.41 2007 32 3.26 2008 35 3.63 2009 38 4.15 Calculate the value of Pearson's product moment correlation coefficient. Interpret the value obtained. (7 marks) c) What is the difference between Spearman rank and Pearson's product moment correlation coefficients? (2 marks) ANSQUESTION 4 a) Mr. Aaqib, the Director of Selamat Berjaya Tuition Centre believes that there exist a relationship between the time their student spent for mathematics tuition per month and their score. To prove his assumption, he selects a sample of twelve students randomly and recorded the total hours the student attend mathematics tuition and their score during the monthly test. The data collected is as below. X Students Monthly Tuition Hours Score 10 68 12 79 25 100 21 94 19 89 15 75 18 83 22 95 12 73 65 10 17 Monly 84 11 15 78 12 20 89 MV 1) State dependent variable and independent variable. li ) Draw a scatter diagram to represent the above data, ifi) Calculate the product moment coefficient of correlation and comment on the results obtained. (10 marks)Question 2 The SPSS output below shows investigation between amount of sodium (%) and BMI (kg/m2) taken from 15 randomly selected students in ABC Faculty. Model Summary Adjusted R Std. Error of Model R R Square Square the Estimate 1 820 672 647 3.511 Coefficients Standardized Unstandardized Coefficients Coefficients Model B Sid Error Beta Sia 1 (Constant) 18 771 2.061 9.108 000 Amount of sodium (95) 2.813 544 820 5.166 000 a) State the dependent and independent variable. (2 marks) b) State the value of the slope and intercept. Interpret their meaning. (4 marks) c) Determine the strength of the relationship between the variables and explain the value obtained. (2 marks) d) Write the regression equation. Hence, estimate the BMI value if the amount of sodium is 8.5%. (2 marks)

Step by Step Solution

There are 3 Steps involved in it

Step: 1

blur-text-image

Get Instant Access to Expert-Tailored Solutions

See step-by-step solutions with expert insights and AI powered tools for academic success

Step: 2

blur-text-image_2

Step: 3

blur-text-image_3

Ace Your Homework with AI

Get the answers you need in no time with our AI-driven, step-by-step assistance

Get Started

Recommended Textbook for

Calculus I With Integrated Precalculus

Authors: Laura Taalman

1st Edition

1464153027, 9781464153020

More Books

Students also viewed these Mathematics questions