Answered step by step
Verified Expert Solution
Link Copied!

Question

1 Approved Answer

GIVE TYPED WRITING SO I CAN UNDERSTAND CLEARLY. Kindly give correct answers and step by step working.do not skip steps.Mention clearly about the formula and

GIVE TYPED WRITING SO I CAN UNDERSTAND CLEARLY.

Kindly give correct answers and step by step working.do not skip steps.Mention clearly about the formula and the conversion.be very clear.do not skip steps.be very clear.NUMBER THE Ans CLEARLY.

QMT245OCT2008
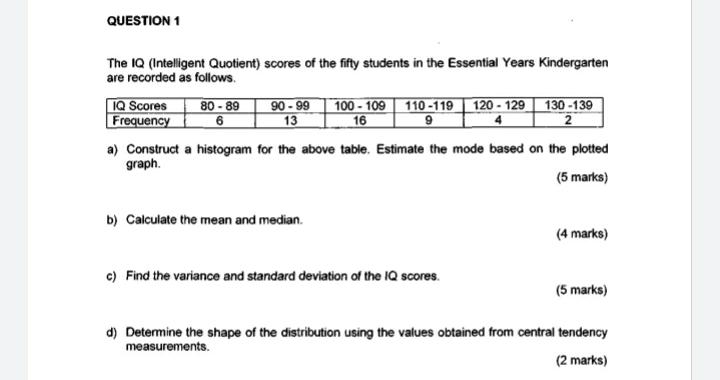
image text in transcribedimage text in transcribedimage text in transcribedimage text in transcribed
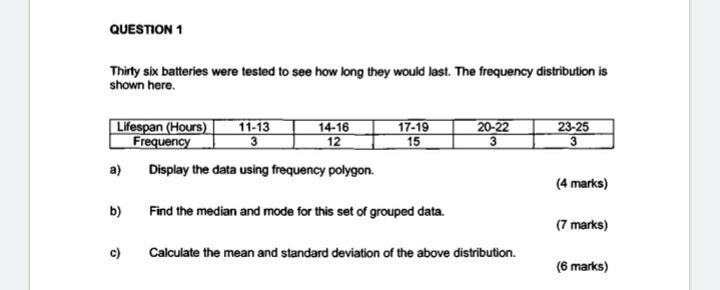
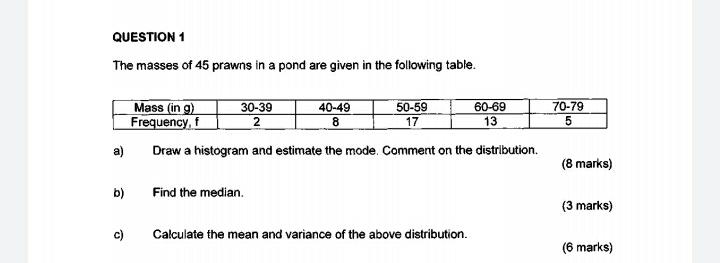
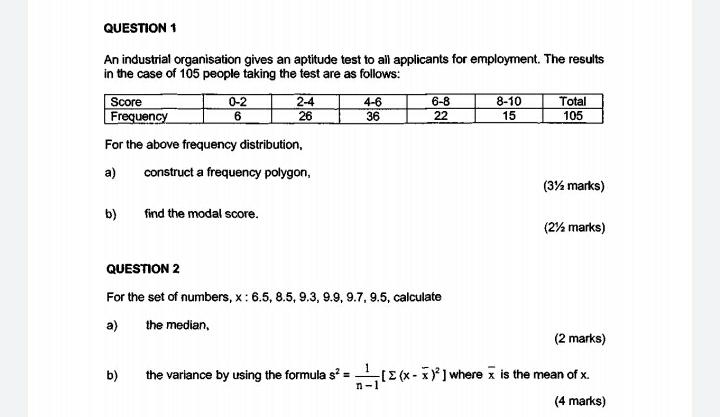
QUESTION 1 The IQ (Intelligent Quotient) scores of the fifty students in the Essential Years Kindergarten are recorded as follows. IQ Scores 80 - 89 90 - 99 100 - 109 110-119 120 - 129 130-139 Frequency 6 13 16 9 4 2 a) Construct a histogram for the above table, Estimate the mode based on the plotted graph. (5 marks) b) Calculate the mean and median. (4 marks) c) Find the variance and standard deviation of the IQ scores. (5 marks) d) Determine the shape of the distribution using the values obtained from central tendency measurements. (2 marks)QUESTION 1 Thirty six batteries were tested to see how long they would last. The frequency distribution is shown here. Lifespan (Hours) 11-13 14-16 17-19 20-22 23-25 Frequency 3 12 15 3 3 a) Display the data using frequency polygon. (4 marks) b) Find the median and mode for this set of grouped data. (7 marks) c) Calculate the mean and standard deviation of the above distribution. (6 marks)QUESTION 1 The masses of 45 prawns in a pond are given in the following table. Mass (in g) 30-39 40-49 50-59 60-69 70-79 Frequency, f 2 8 17 13 5 a Draw a histogram and estimate the mode. Comment on the distribution. (8 marks) b) Find the median. (3 marks) c) Calculate the mean and variance of the above distribution. (6 marks)QUESTION 1 An industrial organisation gives an aptitude test to all applicants for employment. The results in the case of 105 people taking the test are as follows: Score 0-2 2-4 4-6 6-8 8-10 Total Frequency 6 26 36 22 15 105 For the above frequency distribution, a) construct a frequency polygon, (3%% marks) b) find the modal score. (215 marks) QUESTION 2 For the set of numbers, x : 6.5, 8.5, 9.3, 9.9, 9.7, 9.5, calculate a) the median. (2 marks) b) the variance by using the formula s' = [ E (x - x )" ] where x is the mean of x. n - (4 marks)

Step by Step Solution

There are 3 Steps involved in it

Step: 1

blur-text-image

Get Instant Access to Expert-Tailored Solutions

See step-by-step solutions with expert insights and AI powered tools for academic success

Step: 2

blur-text-image

Step: 3

blur-text-image

Ace Your Homework with AI

Get the answers you need in no time with our AI-driven, step-by-step assistance

Get Started

Recommended Textbook for

Calculus

Authors: Laura Taalman, Peter Kohn

1st Edition

1464153035, 9781464153037

More Books

Students also viewed these Mathematics questions