Answered step by step
Verified Expert Solution
Question
1 Approved Answer
Given: Heineken Case Info-Below are financial measurements to analyze questions. *some info given might not be necessary to do calculations. Please show calculations with brief
Given: Heineken Case Info-Below are financial measurements to analyze questions. *some info given might not be necessary to do calculations. Please show calculations with brief description for Understanding. Thank You
questions:
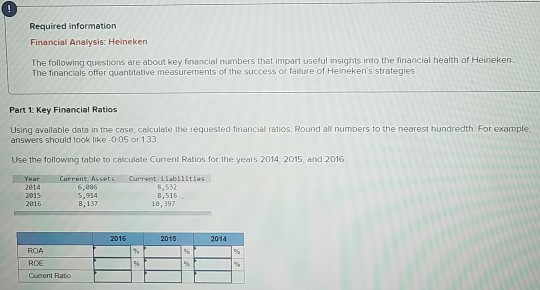
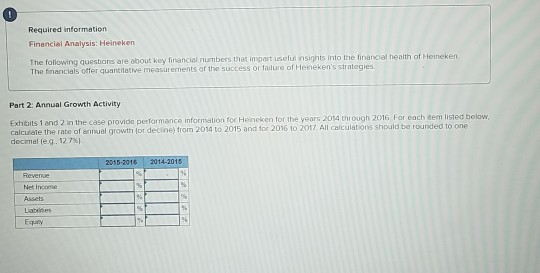
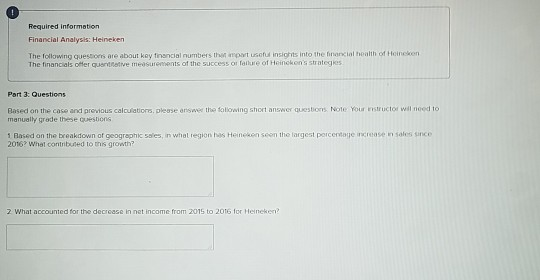
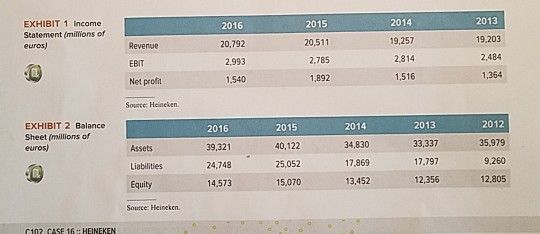
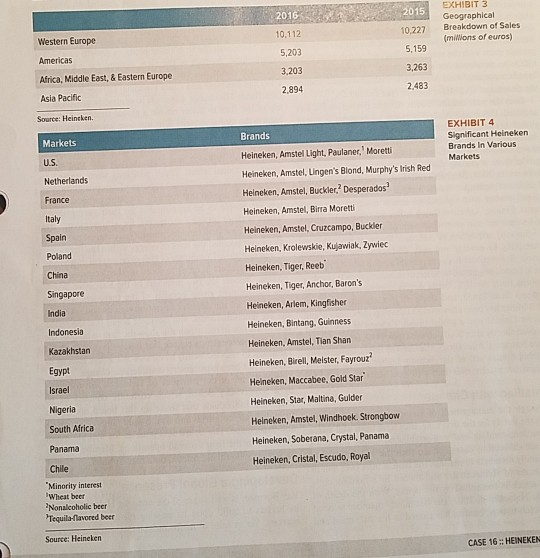
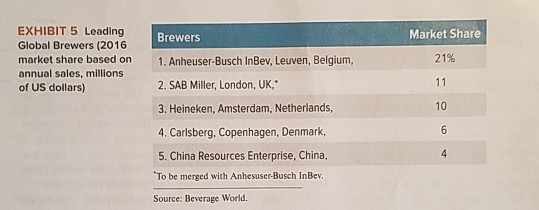
2016 2015 2013 EXHIBIT 1 Income Statement millions of euros) Revenue 20.792 2,993 1,540 EBIT 2014 19,257 2,814 1,516 20,511 2.785 1,892 19,203 2,484 1,364 Net profit Source: Heineken EXHIBIT 2 Balance Sheet (millions of 2015 euros) Assets 2016 39,321 24.748 14,573 2014 34,830 17,869 13,452 40,122 25.052 15,070 2013 33,337 17.797 12,356 2012 35,979 9,260 12,805 Liabilities Equity Source: Heineken 1402 CACE 16 HEINEKEN 2015 EXHIBIT 3 Geographical Breakdown of Sales (millions of euros) 10.227 Western Europe 2016 10,112 5,203 3,203 2,894 Americas 5,159 3,263 2.483 Africa, Middle East, & Eastern Europe Asia Pacific Source: Heineken Markets EXHIBIT 4 Significant Heineken Brands In Various Markets U.S. Netherlands France Italy Spain Poland China Singapore Brands Heineken, Amstel Light, Paulaner, Moretti Heineken, Amstel. Lingen's Blond, Murphy's Irish Red Heineken, Amstel, Buckler. Desperados Heineken, Amstel, Birra Moretti Heineken, Amstel. Cruzcampo, Buckler Heineken, Krolewskie, Kujawiak, Zywiec Heineken, Tiger, Reeb Heineken, Tiger, Anchor, Baron's Heineken, Arlem, Kingfisher Heineken, Bintang, Guinness Heineken, Amstel, Tian Shan Heineken, Birell, Melster, Fayrouz? Heineken, Maccabee, Gold Star Heineken, Star, Maltina, Gulder Heineken, Amstel, Windhoek. Strongbow Heineken, Soberana, Crystal Panama Heineken, Cristal, Escudo, Royal India Indonesia Kazakhstan Egypt Israel Nigeria South Africa Panama Chile "Minority interest "Wheat beer Nonalcoholic beer Tequilavored beer Source: Heineken CASE 16: HEINEKEN Brewers EXHIBIT 5 Leading Global Brewers (2016 market share based on annual sales, millions of US dollars) Market Share 21% 1. Anheuser-Busch InBev, Leuven, Belgium, 2. SAB Miller, London, UK," 3. Heineken, Amsterdam, Netherlands, 4. Carlsberg, Copenhagen, Denmark, 5. China Resources Enterprise, China, To be merged with Anhesuser-Busch InBev. Source: Beverage World. Required information Financial Analysis: Heineken The following questions are about key financial numbers that impart useful insights into the financial health of Heineken The financials offer quantitative measurements of the success or failure of Heineken's strategies Part 1: Key Financial Ratios Using available data in the case, calculate the requested financial ratios. Round all numbers to the nearest hundredth For example answers should look like-005 or 133 Use the following table to calculate Current Ratios for the years 2014 2015 and 2016 Year Current Assets 6.086 5.914 8,137 Current Liabilities 8.532 8,516 10,397 2016 2015 2014 ROA ROEP Current Ratio Required information Financial Analysis: Heineken The following questions are about key financial numbers that impart useluinsights into the financial health of Heineken The financials offer quantitative measurements of the success or failure of Heineken's strategies Part 2: Annual Growth Activity Exhibits 1 and 2 in the case provide performance information for Hencken for the years 2014 through 2016 For each tem listed below calculate the rate of annual growth of decine from 2014 to 2015 ond for 2016 10 2017 All calculations should be rounded to one decimale 9. 12.7%) 2015-2016 2014-2015 Required information Financial Analysis: Heineken The following questions are about key financial numbers th US insichts into the financial The financials offer quantitative measurements of the success or failure of Heinekens strategies Part 3: Questions structor wil need to Based on the case and previous calculations, please answer the following short answer questions. Note Your manually grade these questions 1 Rased on the breakdown or geographies, in wholregions Heinekens 2016? What contributed to this growth? 2 What accounted for the decrease in net income from 2015 to 2016 for Heineken
Step by Step Solution
There are 3 Steps involved in it
Step: 1

Get Instant Access to Expert-Tailored Solutions
See step-by-step solutions with expert insights and AI powered tools for academic success
Step: 2

Step: 3

Ace Your Homework with AI
Get the answers you need in no time with our AI-driven, step-by-step assistance
Get Started


