

Answered step by step
Verified Expert Solution
Question
1 Approved Answer
Given the 5 functions ( f 1 - f 5 ) , and the live script provided, write a script to plot all the functions
Given the functions ff and the live script provided, write a script to plot all the functions as shown in the live script.
f:
function y fx
x is a scalar, and y is a scalar
if lengthx ~
errorx is wrong dimensions'
end
y x x;
end
f:
function y fx
x is a scalar, and y is a vector
if lengthx ~
errorx is wrong dimensions'
end
y x; x;
end
f:
function y fx
input is a scalar, output is a vector
if lengthx ~
errorx is wrong dimensions'
end
y x; x; x x;
end
f:
function y fx
x is a vector of dimension x y is a vector of dimension
if sizex ~
errorx is wrong dimensions'
end
A xx; x x x;
y A x;
end
f:
function y fx
x is a vector of dimension y is a vector of dimension
if lengthx ~
errorx is wrong dimensions'
end
A xx; x x x; x x;;
y A x;
end
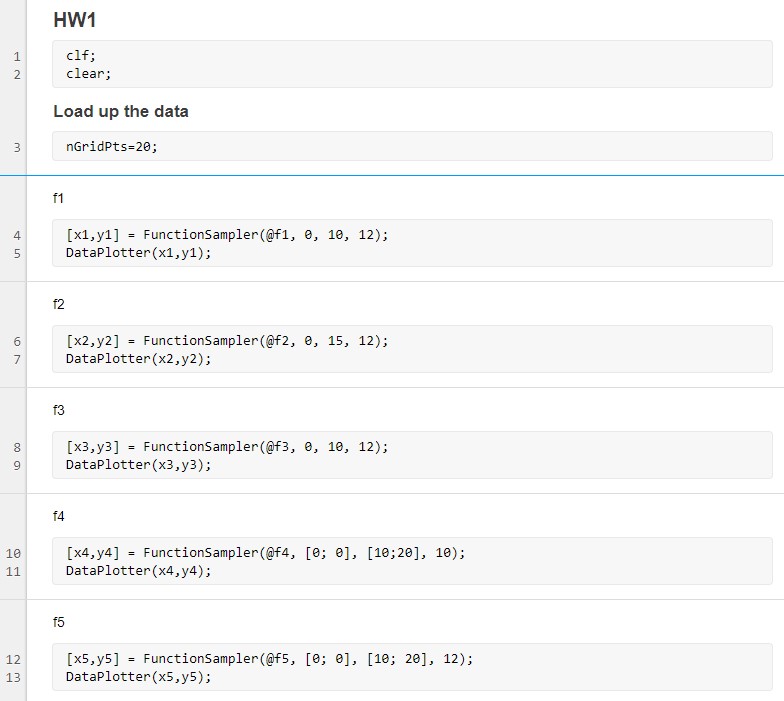
Live script:
HW
clf;
clear;
Load up the data
nGridPts;
f
FunctionSampler @;
DataPlotter xy;
f
FunctionSampler @;
DataPlotter xy;
f
FunctionSampler @;
DataPlotter xy;
f
FunctionSampler @;;;
DataPlotter ;
f
FunctionSampler @;;;
DataPlotterxy;
All twodimensional functions x has two dimensions should be plotted in a contour plot f and f All onedimensional functions should be in line or scatter plots ff
Step by Step Solution
There are 3 Steps involved in it
Step: 1

Get Instant Access to Expert-Tailored Solutions
See step-by-step solutions with expert insights and AI powered tools for academic success
Step: 2

Step: 3
Ace Your Homework with AI
Get the answers you need in no time with our AI-driven, step-by-step assistance
Get Started
Nested Relations And Complex Objects In Databases Lncs 361
Authors: Serge Abiteboul ,Patrick C. Fischer ,Hans-Jorg Schek
1st Edition
3540511717, 978-3540511717