Answered step by step
Verified Expert Solution
Question
1 Approved Answer
Given the following data, answer the below questions - Exhibit 2 Product Class Cost Analysis (Normal Year) Product Lines Aggregate A B C Sales at
Given the following data, answer the below questions -
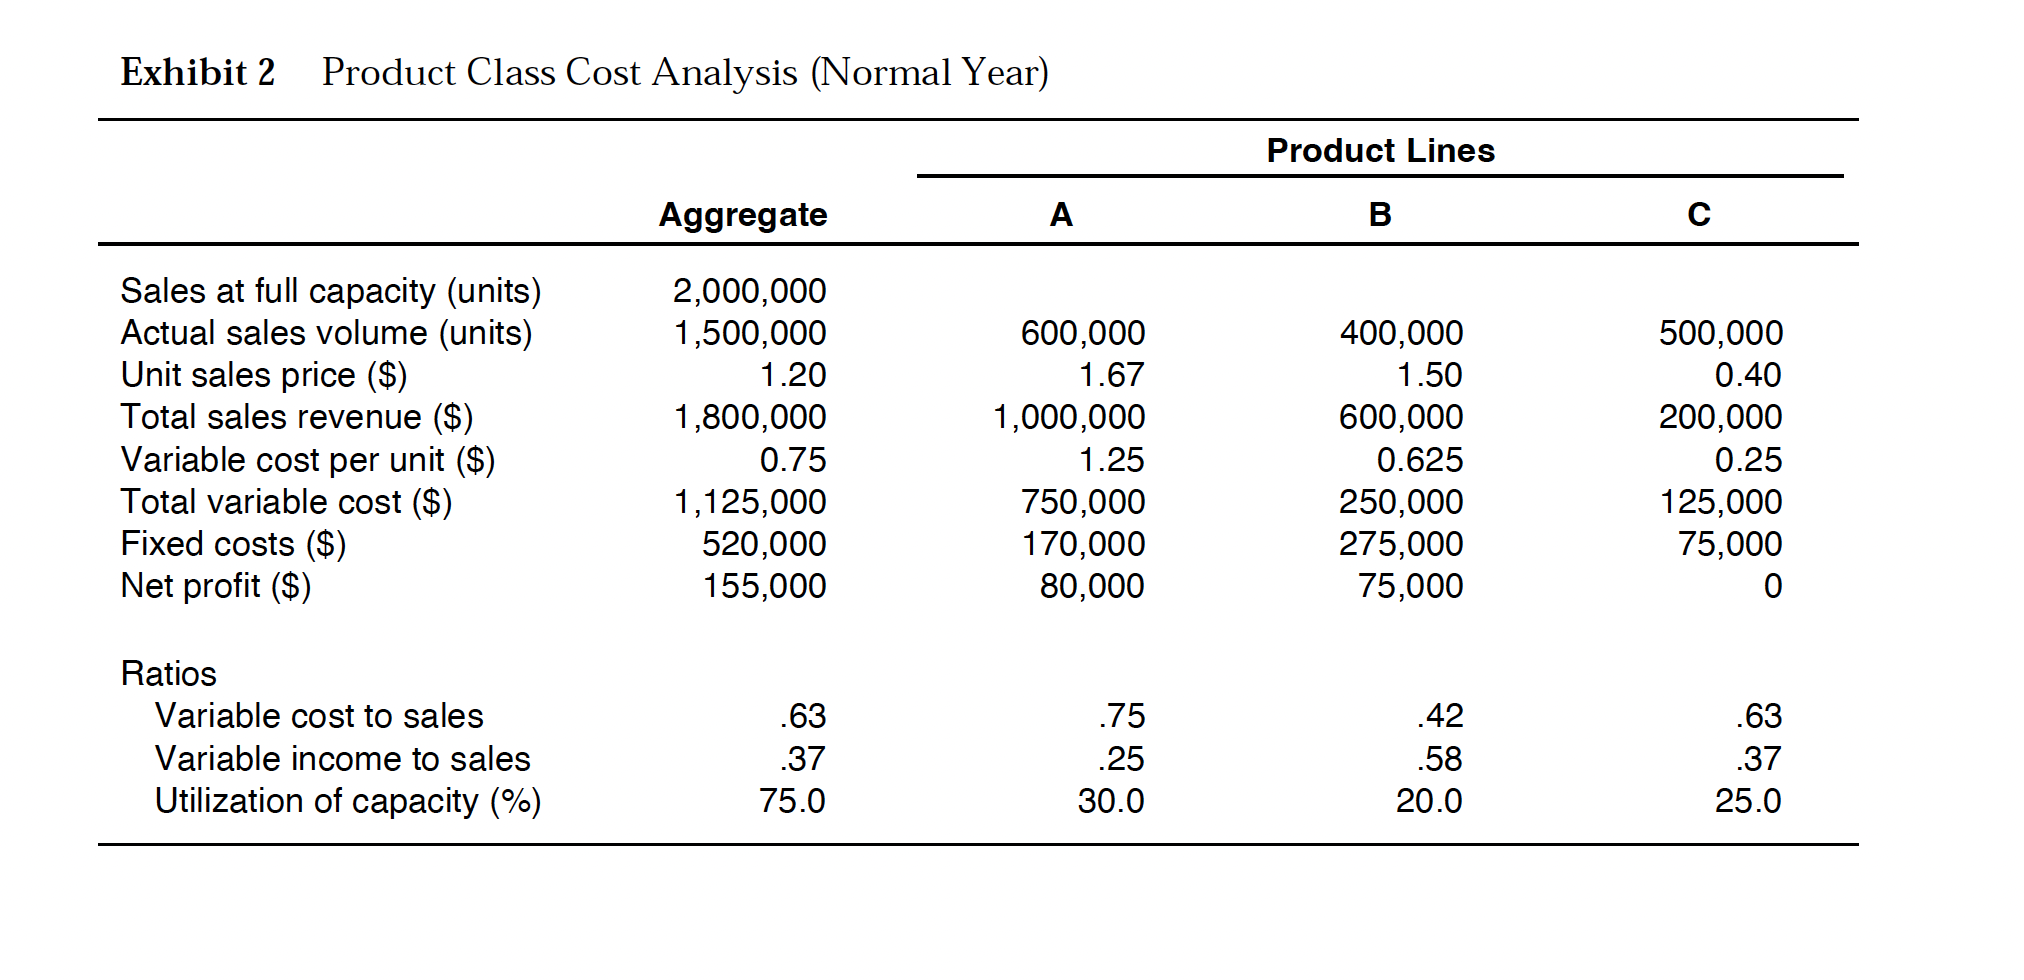
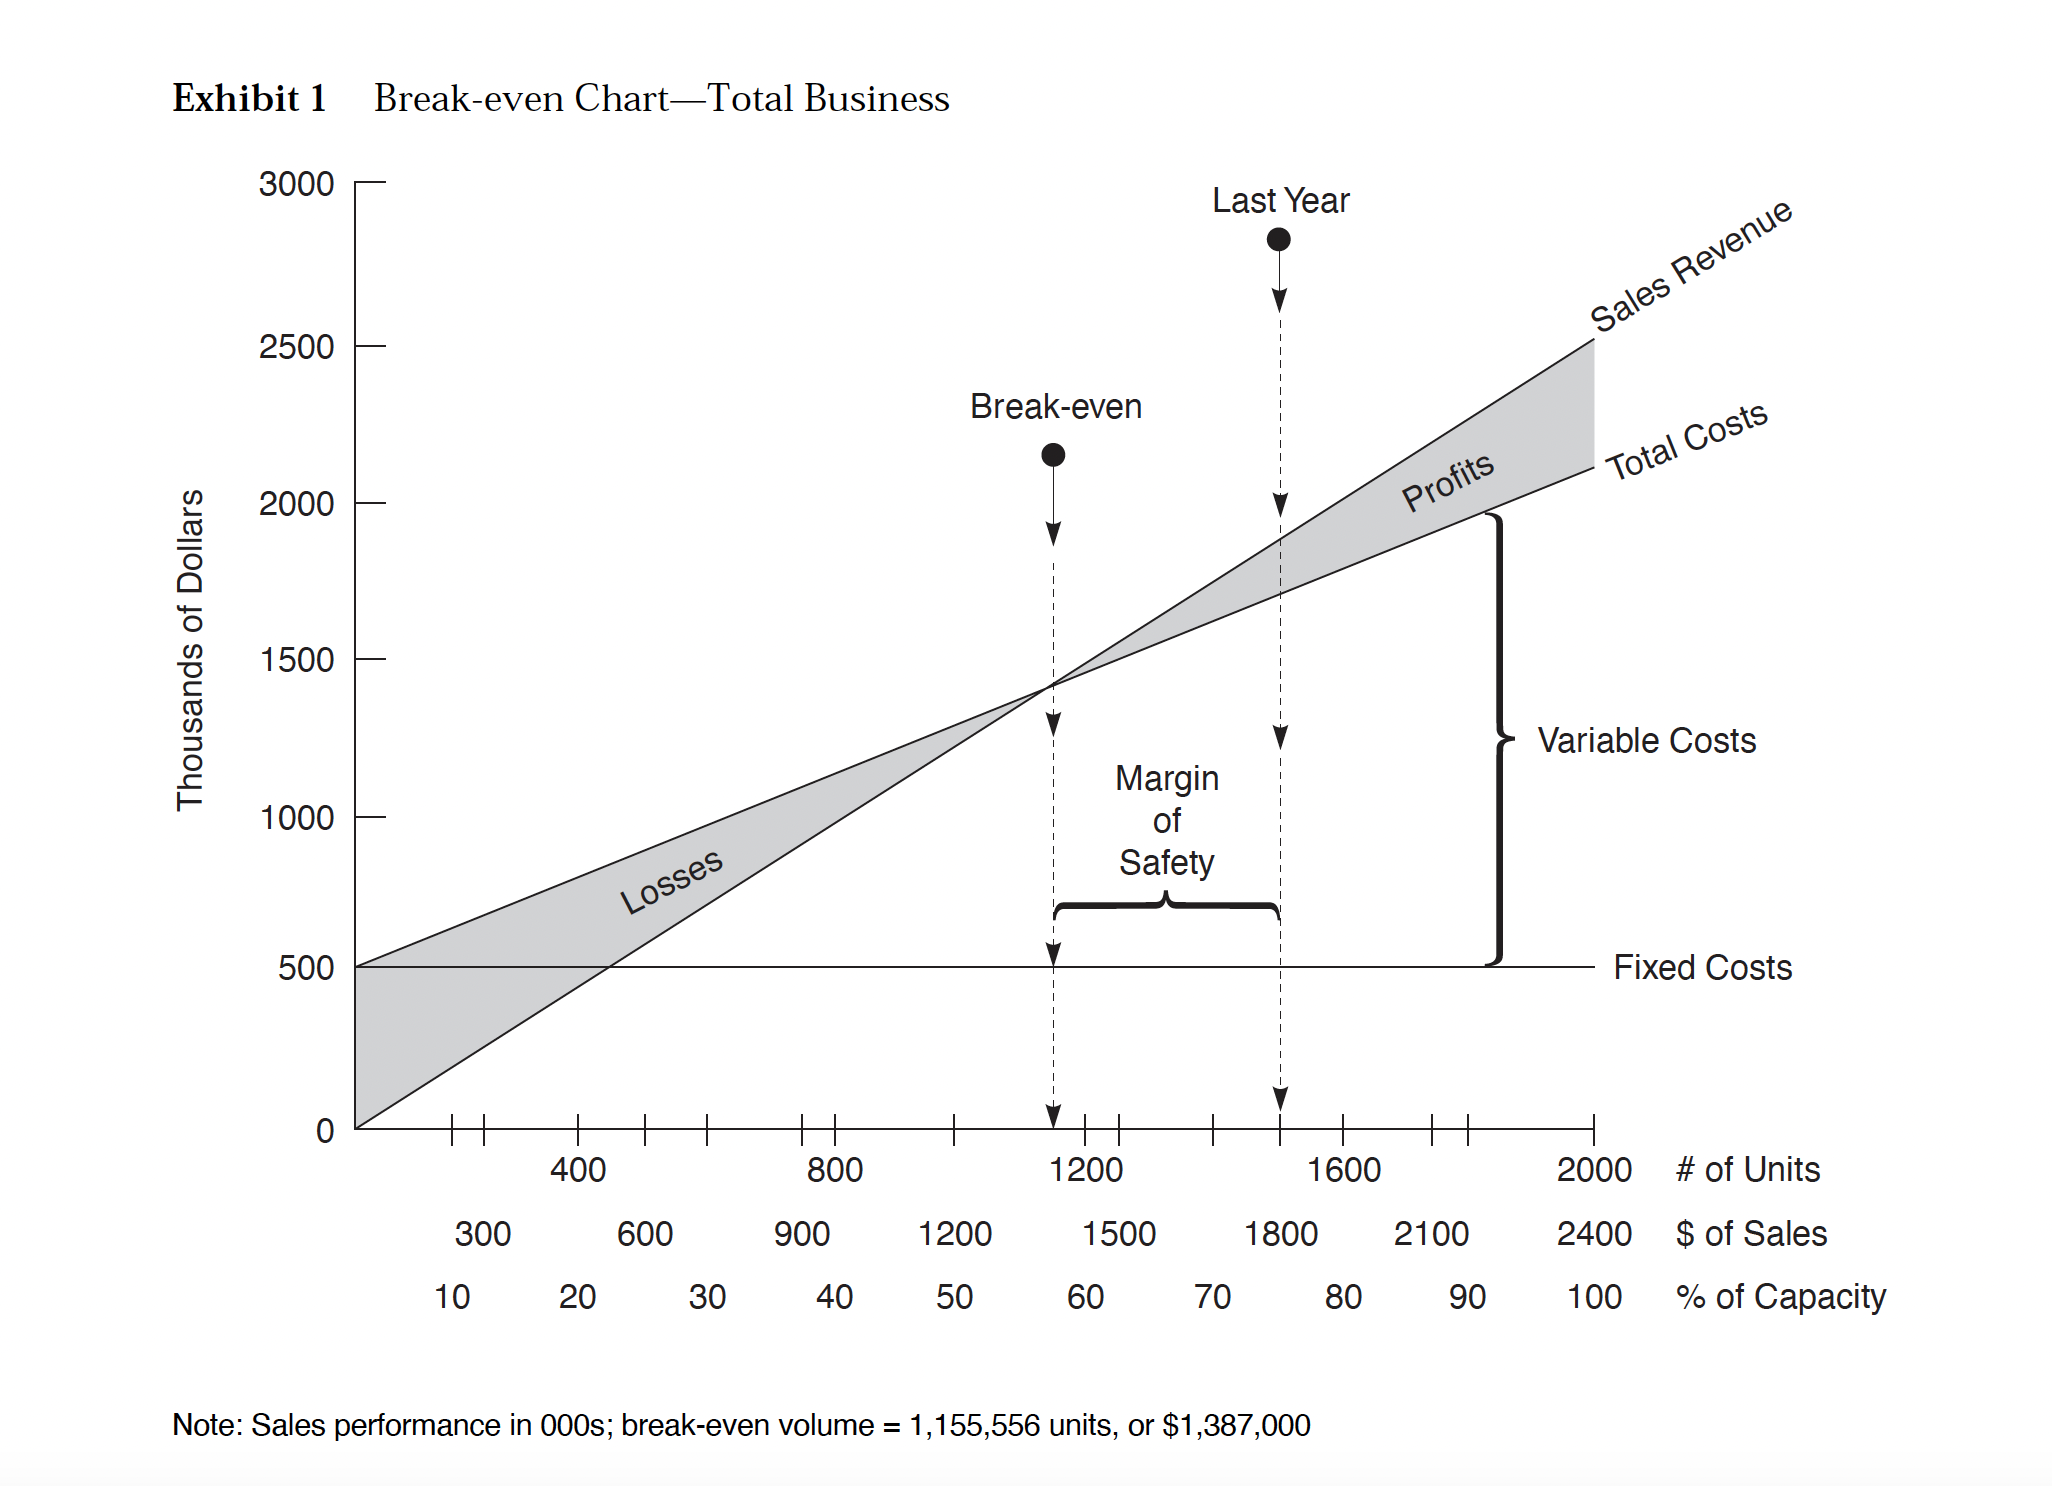
Exhibit 2 Product Class Cost Analysis (Normal Year) Product Lines Aggregate A B C Sales at full capacity (units) 2,000,000 Actual sales volume (units) 1 ,500,000 600,000 400,000 500,000 Unit sales price ($) 1.20 1.67 1.50 0.40 Total sales revenue ($) 1 ,800,000 1,000,000 600,000 200,000 Variable cost per unit ($) 0.75 1.25 0.625 0.25 Total variable cost ($) 1 ,125,000 750,000 250,000 125,000 Fixed costs ($) 520,000 170,000 275,000 75,000 Net profit ($) 155,000 80,000 75,000 0 Ratios Variable cost to sales .63 .75 .42 .63 Variable income to sales 37 25 58 37 Utilization of capacity (/o) 75.0 30.0 20.0 25.0 Exhibit 1 Breakeven ChartTotal Business 3000 Last Year 09 l \"'9\" I 908% 2500 3 Break-even I s I 10195005K 2000 r 1500 Variable Costs Thousands of Dollars 1 000 500 V Fixed Costs I I 0 I I I I I I I I V I I I I I I I I 400 800 1200 1600 2000 # Of Units 300 600 900 1 200 1 500 1 800 21 00 2400 $ Of Sales 10 20 30 40 50 60 70 80 90 100 % of Capacity Note: Sales performance in 0005; break-even volume = 1,155,556 units, or $1,387,000
Step by Step Solution
There are 3 Steps involved in it
Step: 1
Get Instant Access to Expert-Tailored Solutions
See step-by-step solutions with expert insights and AI powered tools for academic success
Step: 2
Step: 3
Ace Your Homework with AI
Get the answers you need in no time with our AI-driven, step-by-step assistance
Get Started