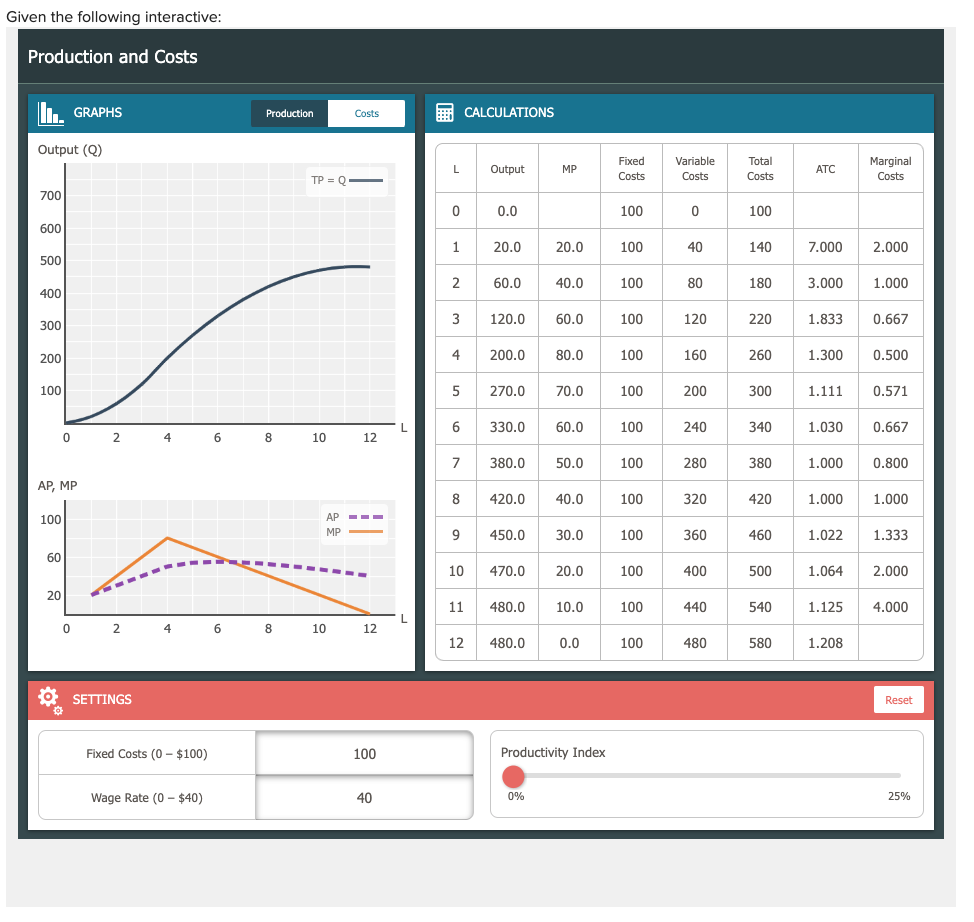

Given the following interactive: Production and Costs GRAPHS Output (Q) 700 600 500 400 300 200 100 0 2 AP, MP 100 60 20 Production TP = Q 6 8 10 12 AP MP 6 Fixed Costs (0 - $100) Wage Rate (0 - $40) 0 2 O SETTINGS Costs 8 10 12 100 40 L L L 0 CALCULATIONS Output MP 0.0 20.0 20.0 60.0 40.0 120.0 60.0 200.0 80.0 270.0 70.0 330.0 60.0 380.0 50.0 420.0 40.0 450.0 30.0 470.0 20.0 480.0 10.0 480.0 0.0 Productivity Index 0% 1 2 3 4 5 6 7 8 9 10 11 12 Fixed Costs 100 100 100 100 100 100 100 100 100 100 100 100 100 Variable Costs 0 40 80 120 160 200 240 280 320 360 400 440 480 Total Costs 100 140 180 220 260 300 340 380 420 460 500 540 580 ATC Marginal Costs 7.000 2.000 3.000 1.000 1.833 0.667 1.300 0.500 1.111 0.571 1.030 0.667 1.000 0.800 1.000 1.000 1.022 1.333 1.064 2.000 1.125 4.000 1.208 Reset 25% Instructions: Click the buttons above the graphing window to show either production functions or cost functions. Type in values for Fixed Costs or Wage Rate (the cost per worker). Move the Productivity Index right to see the effect of increasing productivity by up to 25%. The table and graphs will update as Settings are changed. Set Fixed Costs to $100, Wage Rate to $40 per worker, and slide the Productivity Index so that 1 worker yields 22 units of output. This represents 10% greater productivity that the firm's current levels. What is the marginal product of the fourth worker? 80 The marginal product of the fourth worker can be calculated as a subtraction problem using two numbers from the table. This calculation is Given the following interactive: Production and Costs GRAPHS Output (Q) 700 600 500 400 300 200 100 0 2 AP, MP 100 60 20 Production TP = Q 6 8 10 12 AP MP 6 Fixed Costs (0 - $100) Wage Rate (0 - $40) 0 2 O SETTINGS Costs 8 10 12 100 40 L L L 0 CALCULATIONS Output MP 0.0 20.0 20.0 60.0 40.0 120.0 60.0 200.0 80.0 270.0 70.0 330.0 60.0 380.0 50.0 420.0 40.0 450.0 30.0 470.0 20.0 480.0 10.0 480.0 0.0 Productivity Index 0% 1 2 3 4 5 6 7 8 9 10 11 12 Fixed Costs 100 100 100 100 100 100 100 100 100 100 100 100 100 Variable Costs 0 40 80 120 160 200 240 280 320 360 400 440 480 Total Costs 100 140 180 220 260 300 340 380 420 460 500 540 580 ATC Marginal Costs 7.000 2.000 3.000 1.000 1.833 0.667 1.300 0.500 1.111 0.571 1.030 0.667 1.000 0.800 1.000 1.000 1.022 1.333 1.064 2.000 1.125 4.000 1.208 Reset 25% Instructions: Click the buttons above the graphing window to show either production functions or cost functions. Type in values for Fixed Costs or Wage Rate (the cost per worker). Move the Productivity Index right to see the effect of increasing productivity by up to 25%. The table and graphs will update as Settings are changed. Set Fixed Costs to $100, Wage Rate to $40 per worker, and slide the Productivity Index so that 1 worker yields 22 units of output. This represents 10% greater productivity that the firm's current levels. What is the marginal product of the fourth worker? 80 The marginal product of the fourth worker can be calculated as a subtraction problem using two numbers from the table. This calculation is


