Answered step by step
Verified Expert Solution
Question
1 Approved Answer
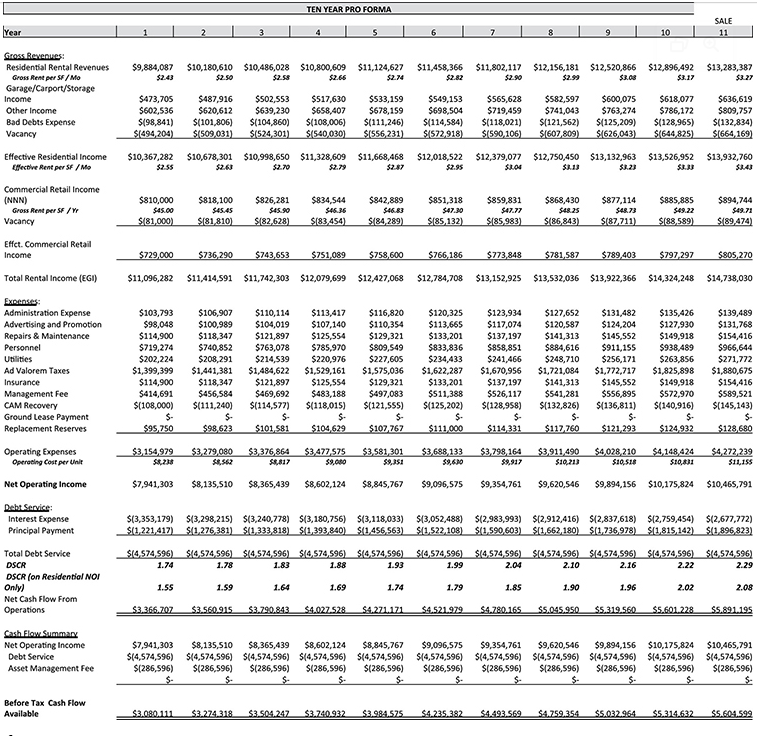
Given the information in the financial statement, calculate the following: (1). levered IRR (2). unlevered IRR (3). Equity Multiple Year TEN YEAR PRO FORMA SALE
Given the information in the financial statement, calculate the following:
(1). levered IRR
(2). unlevered IRR
(3). Equity Multiple

Year TEN YEAR PRO FORMA SALE 10 11 Gross Revenues: Residential Rental Revenues $9,884,087 $10,180,610 $10,486,028 Gross Rent per SF/Mo $2.43 $2.50 $2.58 $10,800,609 $11,124,627 $2.66 $11,458,366 $11,802,117 $12,156,181 $12,520,866 $2.74 $2.82 $2.90 $2.99 $3.08 $12,896,492 $3.17 $13,283,387 $3.27 Garage/Carport/Storage Income Other Income $473,705 Bad Debts Expense Vacancy $487,916 $502,553 $602,536 $620,612 $639,230 $(98,841) $(101,806) $(104,860) $(494,204) Effective Residential Income $10,367,282 Effective Rent per SF/Mo $2.55 $10,678,301 $10,998,650 $2.63 $2.70 $517,630 $533,159 $549,153 $565,628 $658,407 $678,159 $698,504 $719,459 $(108,006) $(111,246) $(114,584) $(118,021) $(509,031) $(524,301) $(540,030) $(556,231) $(572,918) $(590,106) $11,328,609 $11,668,468 $12,018,522 $2.79 $2.87 $600,075 $582,597 $618,077 $636,619 $741,043 $763,274 $786,172 $809,757 $(121,562) $(125,209) $(128,965) $(132,834) $(607,809) $(626,043) $(644,825) $(664,169) $2.95 53.13 $12,379,077 $12,750,450 $13,132,963 $13,526,952 53.04 53.23 $13,932,760 53.33 $3.43 Commercial Retail Income (NNN) $810,000 Gross Rent per SF/YF $45.00 $818,100 $45.45 $826,281 $45.90 Vacancy $(81,000) $(81,810) $(82,628) $834,544 $46.36 $(83,454) $842,889 $46.83 $(84,289) $851,318 $47.30 $(85,132) $859,831 $47.77 $868,430 $48.25 $(85,983) $(86,843) $877,114 $48.73 $(87,711) $885,885 $49.22 $(88,589) $894,744 $49.71 $(89,474) Effct. Commercial Retail Income $729,000 $736,290 $743,653 $751,089 $758,600 $766,186 $773,848 $781,587 $789,403 $797,297 $805,270 Total Rental Income (EGI) $11,096,282 $11,414,591 $11,742,303 $12,079,699 $12,427,068 $12,784,708 $13,152,925 $13,532,036 $13,922,366 $14,324,248 $14,738,030 Expenses: Administration Expense $103,793 $106,907 $110,114 $113,417 $116,820 $120,325 $123,934 $127,652 $131,482 $135,426 $139,489 Advertising and Promotion $98,048 $100,989 $104,019 $107,140 $110,354 $113,665 $117,074 $120,587 $124,204 $127,930 $131,768 Repairs & Maintenance $114,900 $118,347 $121,897 $125,554 $129,321 $133,201 $137,197 $141,313 $145,552 $149,918 $154,416 Personnel $719,274 $740,852 $763,078 $785,970 $809,549 $833,836 $858,851 $884,616 $911,155 $938,489 $966,644 Utilities $202,224 $208,291 $214,539 $220,976 $227,605 $234,433 $241,466 $248,710 $256,171 $263,856 $271,772 Ad Valorem Taxes $1,399,399 $1,441,381 $1,484,622 $1,529,161 $1,575,036 $1,622,287 $1,670,956 $1,721,084 $1,772,717 $1,825,898 $1,880,675 Insurance $114,900 $118,347 $121,897 $125,554 $129,321 $133,201 $137,197 $141,313 $145,552 $149,918 Management Fee $414,691 $456,584 $469,692 CAM Recovery $(108,000) $(111,240) Ground Lease Payment $- Replacement Reserves $95,750 $98,623 $(114,577) $- $101,581 $483,188 $(118,015) $497,083 $511,388 $526,117 $541,281 $556,895 $572,970 $(121,555) $(125,202) $(128,958) $- $104,629 $ $107,767 $- $111,000 $114,331 $(132,826) $- $117,760 $(136,811) $- $121,293 $(140,916) $154,416 $589,521 $(145,143) $. $124,932 $- $128,680 Operating Expenses $3,154,979 Operating Cost per Unit 58,238 $3,279,080 58,562 $3,376,864 $8,817 $3,477,575 59,080 $3,581,301 59,351 $3,688,133 $9,630 $3,798,164 $9,917 $3,911,490 $10,213 $4,028,210 $10,518 $4,148,424 $10,831 $4,272,239 $11,155 Net Operating Income $7,941,303 $8,135,510 $8,365,439 $8,602,124 $8,845,767 $9,096,575 $9,354,761 $9,620,546 $9,894,156 $10,175,824 $10,465,791 Debt Service: Interest Expense $(3,353,179) Principal Payment $(1,221,417) $(3,298,215) $(3,240,778) $(3,180,756) $(3,118,033) $(3,052,488) $(2,983,993) $(2,912,416) $(2,837,618) $(2,759,454) $(2,677,772) $(1,276,381) $(1,333,818) $(1,393,840) $(1,456,563) $(1,522,108) $(1,590,603) $(1,662,180) $(1,736,978) $(1,815,142) $(1,896,823) Total Debt Service $(4,574,596) $(4,574,596) $(4,574,596) $(4,574,596) $(4,574,596) $14,574,596) $(4,574,596) $(4,574,596) $(4,574,596) $(4,574,596) $(4,574,596) DSCR 1.74 1.78 1.83 1.88 1.93 1.99 2.04 2.10 2.16 2.22 2.29 DSCR (on Residential NOI Only) 1.55 1.59 Net Cash Flow From Operations $3.366.707 $3.560.915 1.64 $3.790.843 $4.027.528 1.69 1.74 1.79 1.85 1.90 1.96 2.02 2.08 $4.271.171 $4.521.979 $4.780.165 $5.045.950 $5.319.560 $5.601.228 $5.891.195 Cash Flow Summary Net Operating Income $7,941,303 $8,135,510 $8,365,439 Debt Service $(4,574,596) $(4,574,596) $(4,574,596) Asset Management Fee $(286,596) $(286,596) $(286,596) $8,602,124 $(4,574,596) $(286,596) $8,845,767 $(4,574,596) $(286,596) $9,096,575 $(4,574,596) $(286,596) S- $9,354,761 $(4,574,596) $(286,596) S- $9,620,546 $(4,574,596) $(286,596) $- $9,894,156 $10,175,824 $10,465,791 $(4,574,596) $(4,574,596) $(4,574,596) $(286,596) $(286,596) S- $(286,596) Before Tax Cash Flow Available $3.080.111 $3.274.318 $3.504.247 $3.740.932 $3.984.575 $4.235.382 $4.493.569 $4.759.354 $5.032.964 $5.314.632 $5.604.599
Step by Step Solution
There are 3 Steps involved in it
Step: 1
Okay here are the calculations 1 Levered IRR Use the cash flows from Before Tax Cash Flow Availa...
Get Instant Access to Expert-Tailored Solutions
See step-by-step solutions with expert insights and AI powered tools for academic success
Step: 2

Step: 3

Ace Your Homework with AI
Get the answers you need in no time with our AI-driven, step-by-step assistance
Get Started


