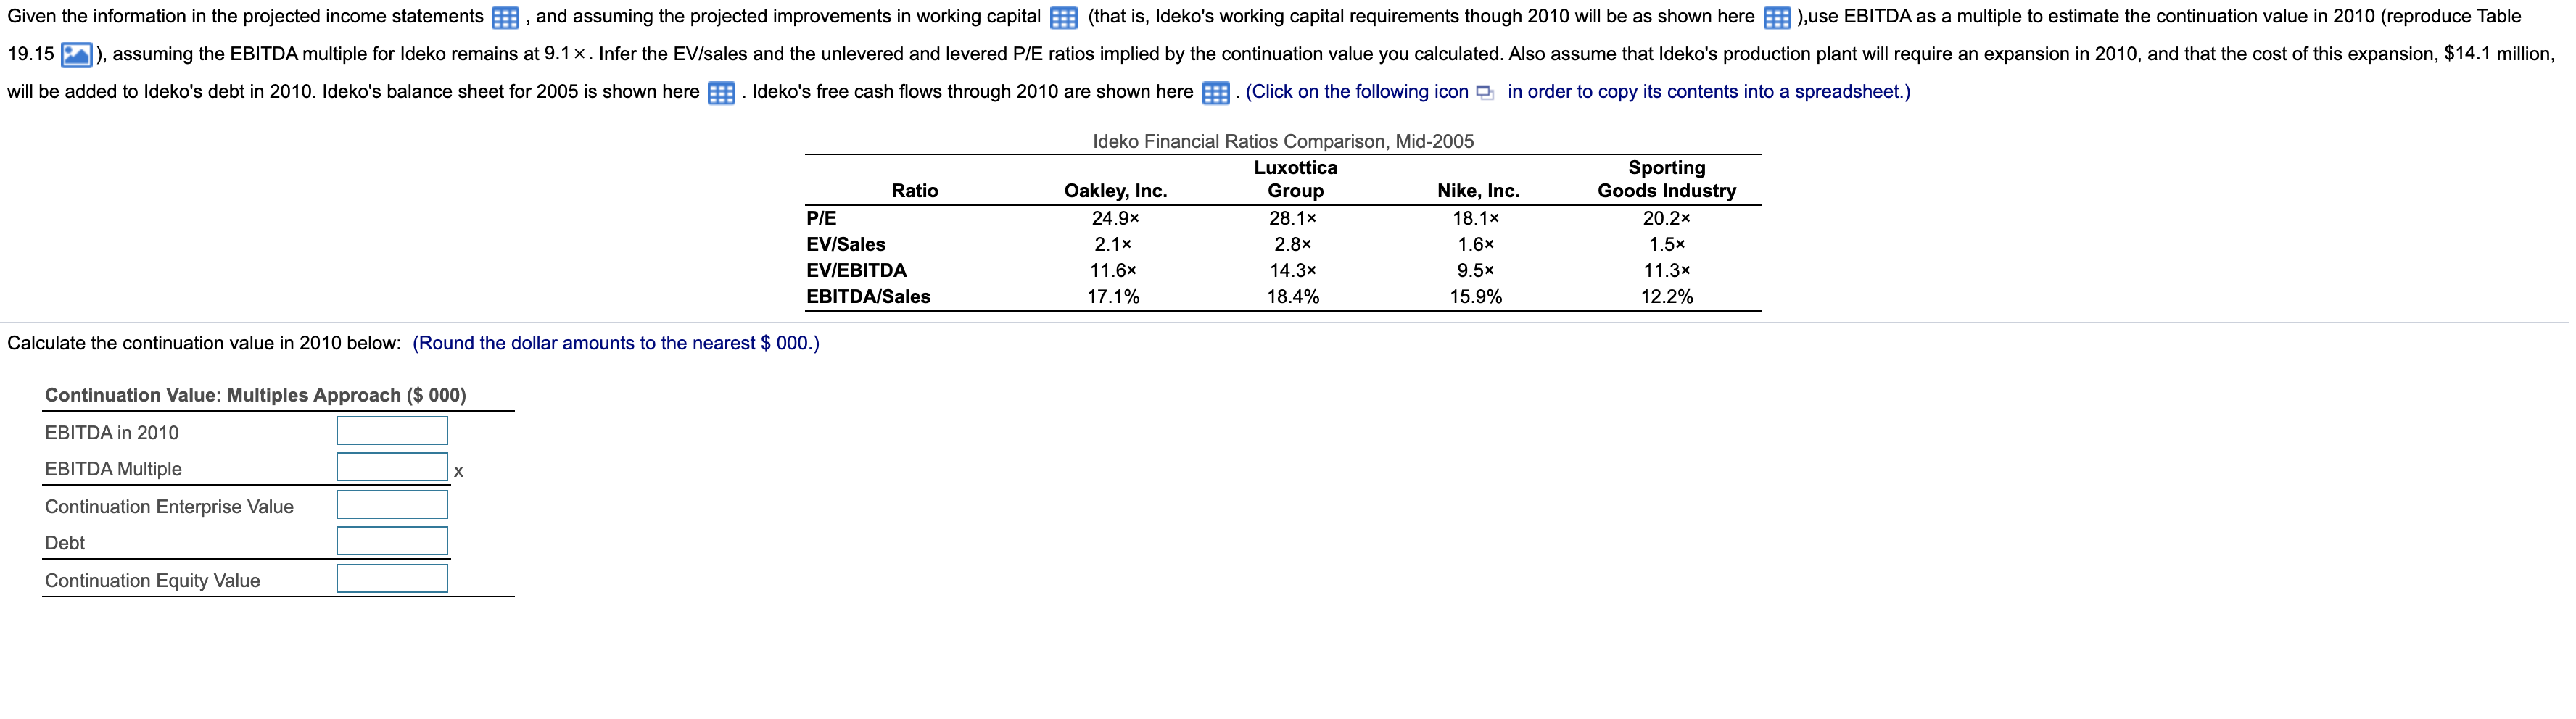
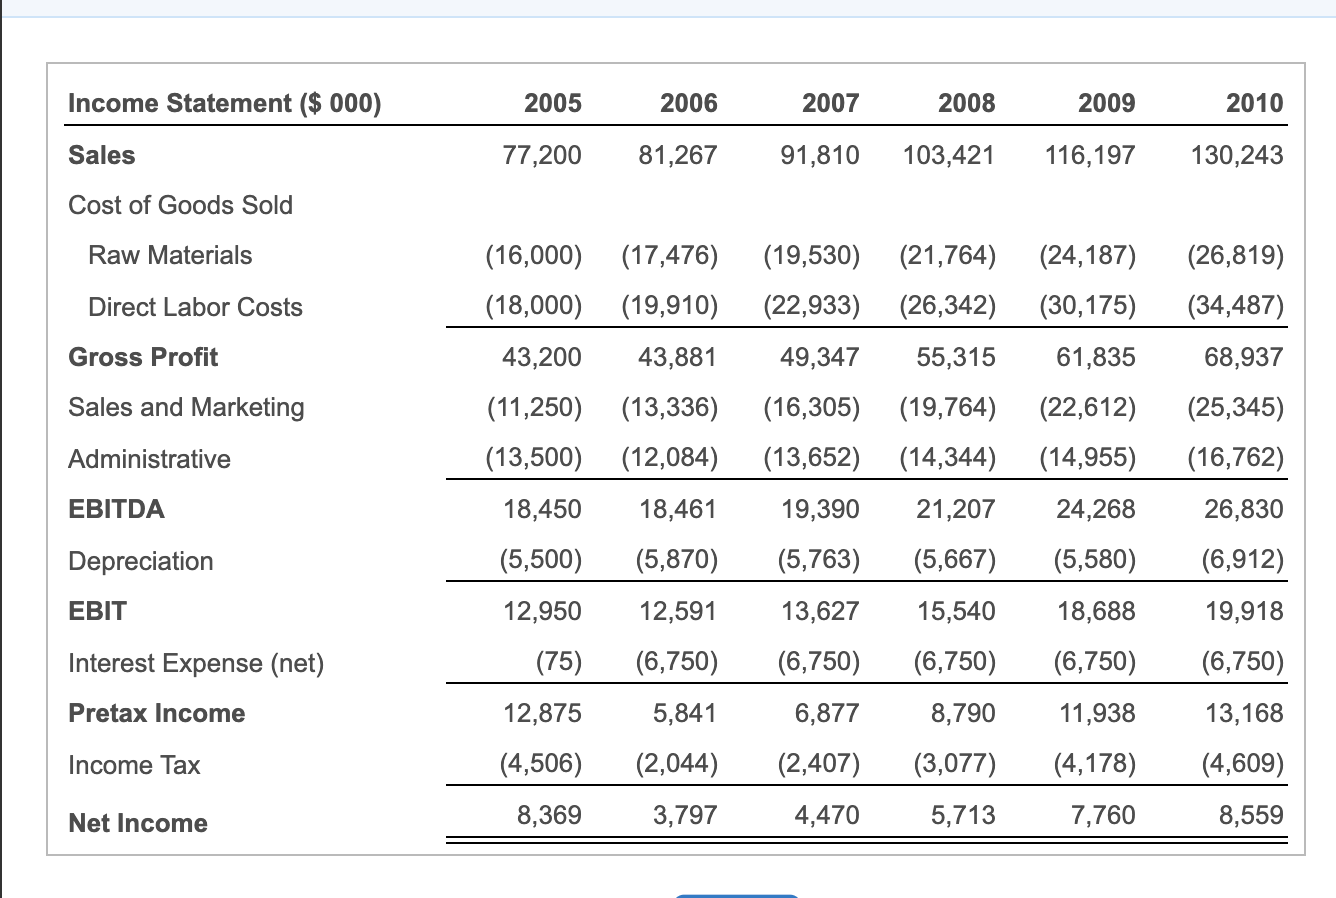
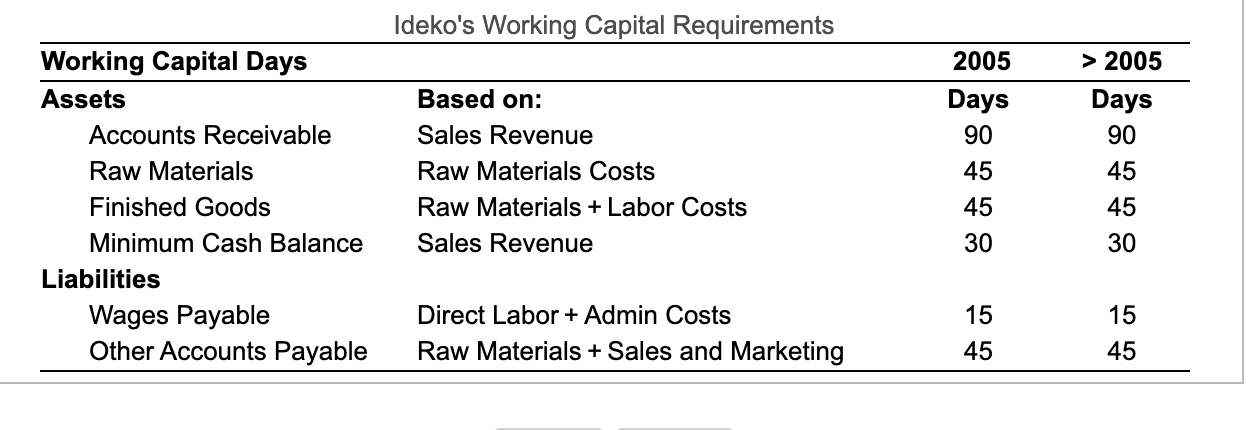
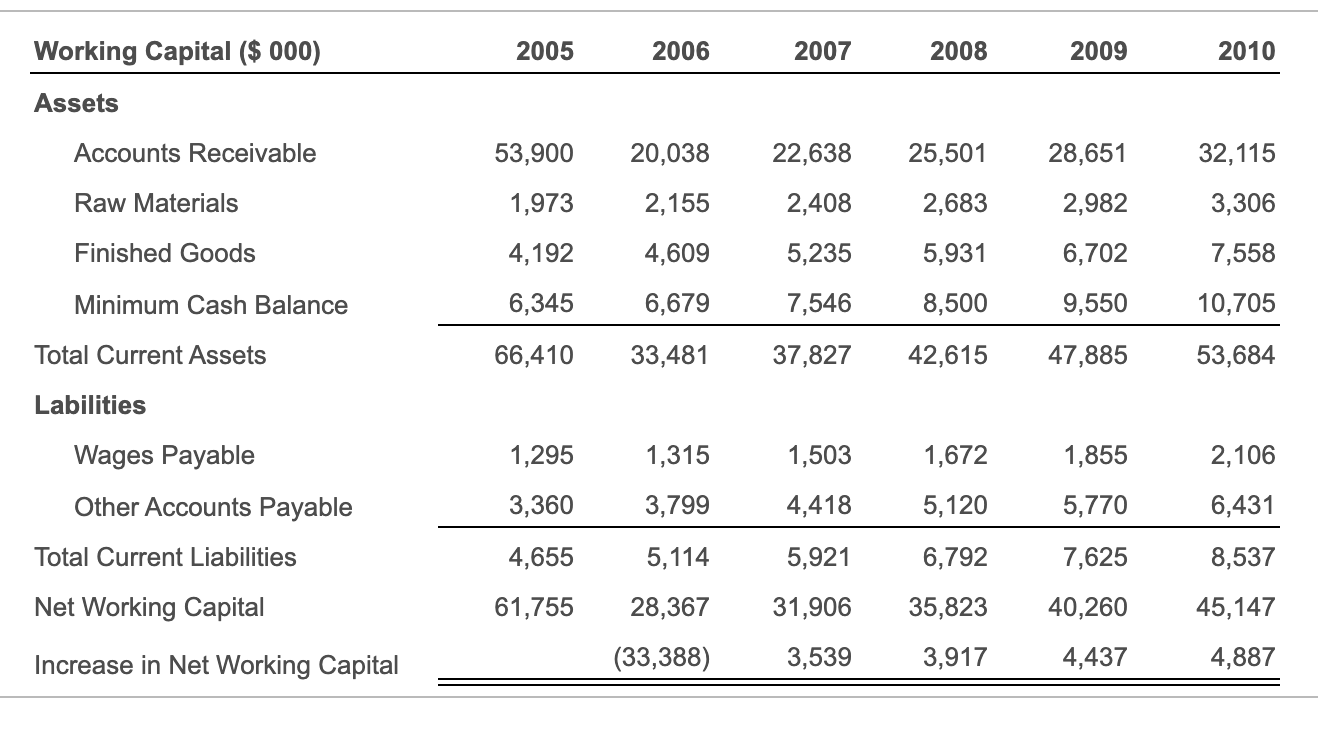
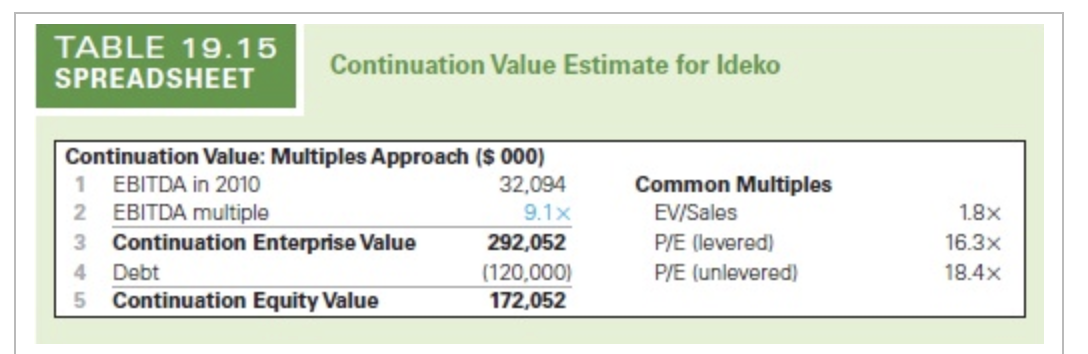
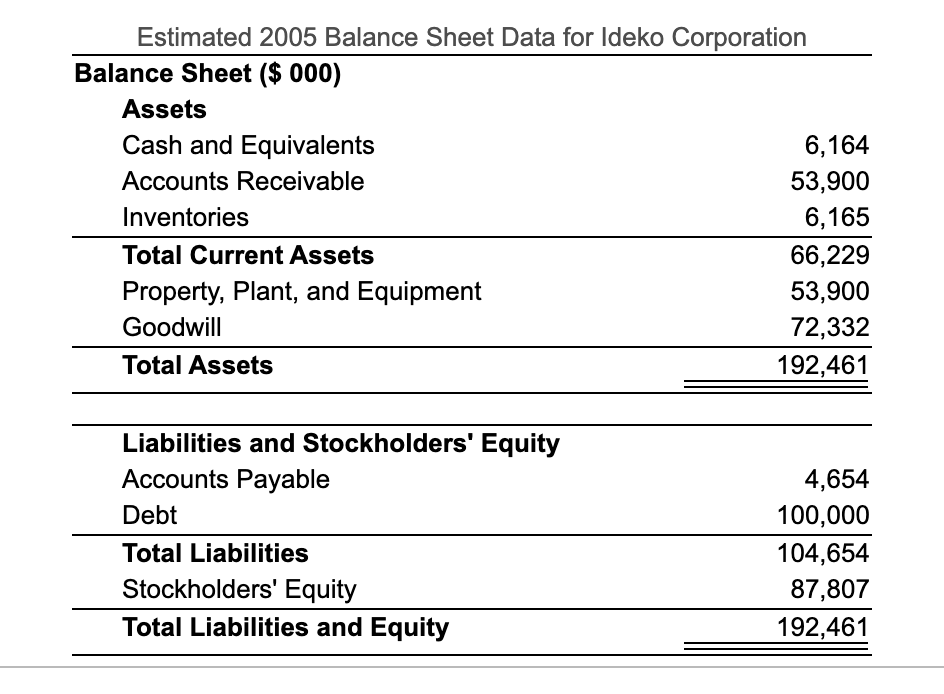
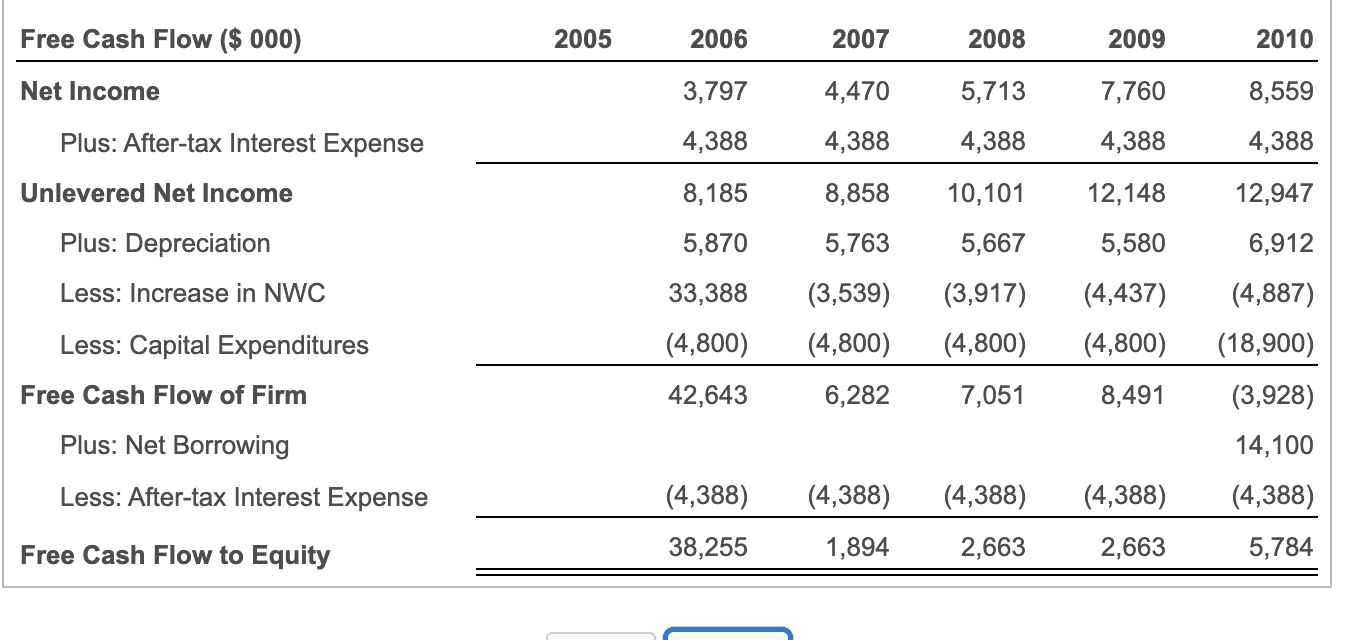
Given the information in the projected income statements and assuming the projected improvements in working capital (that is, Ideko's working capital requirements though 2010 will be as shown here | ),use EBITDA as a multiple to estimate the continuation value in 2010 (reproduce Table 19.15 |), assuming the EBITDA multiple for Ideko remains at 9.1 x. Infer the EV/sales and the unlevered and levered P/E ratios implied by the continuation value you calculated. Also assume that Ideko's production plant will require an expansion in 2010, and that the cost of this expansion, $14.1 million, will be added to Ideko's debt in 2010. Ideko's balance sheet for 2005 is shown here Ideko's free cash flows through 2010 are shown here . (Click on the following icon in order to copy its contents into a spreadsheet.) Ratio P/E EV/Sales EV/EBITDA EBITDA/Sales Ideko Financial Ratios Comparison, Mid-2005 Luxottica Oakley, Inc. Group Nike, Inc. 24.9x 28.1x 18.1x 2.1x 2.8x 1.6x 11.6x 14.3x 9.5x 17.1% 18.4% 15.9% Sporting Goods Industry 20.2x 1.5x 11.3x 12.2% Calculate the continuation value in 2010 below: (Round the dollar amounts to the nearest $ 000.) Continuation Value: Multiples Approach ($ 000) EBITDA in 2010 EBITDA Multiple X Continuation Enterprise Value Debt Continuation Equity Value Income Statement ($ 000) 2005 2006 2007 2008 2009 2010 Sales 77,200 81,267 91,810 103,421 116,197 130,243 Cost of Goods Sold Raw Materials (16,000) (18,000) (17,476) (19,910) (19,530) (21,764) (22,933) (26,342) (24,187) (30,175) (26,819) (34,487) Direct Labor Costs Gross Profit 43,200 43,881 49,347 55,315 61,835 68,937 Sales and Marketing (11,250) (13,500) (13,336) (12,084) (16,305) (19,764) (13,652) (14,344) (22,612) (14,955) (25,345) (16,762) Administrative EBITDA 18,450 18,461 19,390 21,207 24,268 26,830 Depreciation (5,500) (5,870) (5,763) (5,667) (5,580) (6,912) EBIT 12,950 12,591 13,627 15,540 18,688 19,918 Interest Expense (net) (75) (6,750) (6,750) (6,750) (6,750) (6,750) Pretax Income 12,875 5,841 6,877 8,790 11,938 13,168 Income Tax (4,506) (2,044) (2,407) (3,077) (4,178) (4,609) Net Income 8,369 3,797 4,470 5,713 7,760 8,559 Ideko's Working Capital Requirements 2005 Days 90 45 Based on: Sales Revenue Raw Materials Costs Raw Materials + Labor Costs Sales Revenue Working Capital Days Assets Accounts Receivable Raw Materials Finished Goods Minimum Cash Balance Liabilities Wages Payable Other Accounts Payable > 2005 Days 90 45 45 45 30 30 15 Direct Labor + Admin Costs Raw Materials + Sales and Marketing 15 45 45 Working Capital ($ 000) 2005 2006 2007 2008 2009 2010 Assets Accounts Receivable 53,900 20,038 22,638 25,501 28,651 32,115 Raw Materials 1,973 2,155 2,408 2,683 2,982 3,306 Finished Goods 4,192 4,609 5,235 5,931 6,702 7,558 Minimum Cash Balance 6,345 6,679 7,546 8,500 9,550 10,705 Total Current Assets 66,410 33,481 37,827 42,615 47,885 53,684 Labilities 1,295 1,315 1,503 1,672 1,855 2,106 Wages Payable Other Accounts Payable Total Current Liabilities 3,360 3,799 4,418 5,120 5,770 6,431 4,655 5,114 5,921 6,792 7,625 8,537 Net Working Capital 61,755 28,367 31,906 35,823 40,260 45,147 Increase in Net Working Capital (33,388) 3,539 3,917 4,437 4,887 TABLE 19.15 SPREADSHEET Continuation Value Estimate for ldeko Continuation Value: Multiples Approach ($ 000) 1 EBITDA in 2010 32,094 2 EBITDA multiple 9.1x 3 Continuation Enterprise Value 292,052 4 Debt (120,000) 5 Continuation Equity Value 172,052 Common Multiples EV/Sales P/E dlevered) P/E (unlevered) 1.8% 16.3x 18.4x Estimated 2005 Balance Sheet Data for Ideko Corporation Balance Sheet ($ 000) Assets Cash and Equivalents 6,164 Accounts Receivable 53,900 Inventories 6,165 Total Current Assets 66,229 Property, Plant, and Equipment 53,900 Goodwill 72,332 Total Assets 192,461 Liabilities and Stockholders' Equity Accounts Payable Debt Total Liabilities Stockholders' Equity Total Liabilities and Equity 4,654 100,000 104,654 87,807 192,461 Free Cash Flow ($ 000) 2005 2006 2007 2008 2009 2010 Net Income 3,797 4,470 5,713 7,760 8,559 4,388 4,388 4,388 4,388 4,388 Plus: After-tax Interest Expense Unlevered Net Income Plus: Depreciation 8,185 8,858 10,101 12,148 12,947 5,870 5,763 5,667 5,580 6,912 Less: Increase in NWC 33,388 (3,539) (4,800) (3,917) (4,800) (4,437) (4,800) Less: Capital Expenditures (4,800) (4,887) (18,900) (3,928) Free Cash Flow of Firm 42,643 6,282 7,051 8,491 Plus: Net Borrowing 14,100 Less: After-tax Interest Expense (4,388) (4,388) (4,388) (4,388) (4,388) Free Cash Flow to Equity 38,255 1,894 2,663 2,663 5,784 Given the information in the projected income statements and assuming the projected improvements in working capital (that is, Ideko's working capital requirements though 2010 will be as shown here | ),use EBITDA as a multiple to estimate the continuation value in 2010 (reproduce Table 19.15 |), assuming the EBITDA multiple for Ideko remains at 9.1 x. Infer the EV/sales and the unlevered and levered P/E ratios implied by the continuation value you calculated. Also assume that Ideko's production plant will require an expansion in 2010, and that the cost of this expansion, $14.1 million, will be added to Ideko's debt in 2010. Ideko's balance sheet for 2005 is shown here Ideko's free cash flows through 2010 are shown here . (Click on the following icon in order to copy its contents into a spreadsheet.) Ratio P/E EV/Sales EV/EBITDA EBITDA/Sales Ideko Financial Ratios Comparison, Mid-2005 Luxottica Oakley, Inc. Group Nike, Inc. 24.9x 28.1x 18.1x 2.1x 2.8x 1.6x 11.6x 14.3x 9.5x 17.1% 18.4% 15.9% Sporting Goods Industry 20.2x 1.5x 11.3x 12.2% Calculate the continuation value in 2010 below: (Round the dollar amounts to the nearest $ 000.) Continuation Value: Multiples Approach ($ 000) EBITDA in 2010 EBITDA Multiple X Continuation Enterprise Value Debt Continuation Equity Value Income Statement ($ 000) 2005 2006 2007 2008 2009 2010 Sales 77,200 81,267 91,810 103,421 116,197 130,243 Cost of Goods Sold Raw Materials (16,000) (18,000) (17,476) (19,910) (19,530) (21,764) (22,933) (26,342) (24,187) (30,175) (26,819) (34,487) Direct Labor Costs Gross Profit 43,200 43,881 49,347 55,315 61,835 68,937 Sales and Marketing (11,250) (13,500) (13,336) (12,084) (16,305) (19,764) (13,652) (14,344) (22,612) (14,955) (25,345) (16,762) Administrative EBITDA 18,450 18,461 19,390 21,207 24,268 26,830 Depreciation (5,500) (5,870) (5,763) (5,667) (5,580) (6,912) EBIT 12,950 12,591 13,627 15,540 18,688 19,918 Interest Expense (net) (75) (6,750) (6,750) (6,750) (6,750) (6,750) Pretax Income 12,875 5,841 6,877 8,790 11,938 13,168 Income Tax (4,506) (2,044) (2,407) (3,077) (4,178) (4,609) Net Income 8,369 3,797 4,470 5,713 7,760 8,559 Ideko's Working Capital Requirements 2005 Days 90 45 Based on: Sales Revenue Raw Materials Costs Raw Materials + Labor Costs Sales Revenue Working Capital Days Assets Accounts Receivable Raw Materials Finished Goods Minimum Cash Balance Liabilities Wages Payable Other Accounts Payable > 2005 Days 90 45 45 45 30 30 15 Direct Labor + Admin Costs Raw Materials + Sales and Marketing 15 45 45 Working Capital ($ 000) 2005 2006 2007 2008 2009 2010 Assets Accounts Receivable 53,900 20,038 22,638 25,501 28,651 32,115 Raw Materials 1,973 2,155 2,408 2,683 2,982 3,306 Finished Goods 4,192 4,609 5,235 5,931 6,702 7,558 Minimum Cash Balance 6,345 6,679 7,546 8,500 9,550 10,705 Total Current Assets 66,410 33,481 37,827 42,615 47,885 53,684 Labilities 1,295 1,315 1,503 1,672 1,855 2,106 Wages Payable Other Accounts Payable Total Current Liabilities 3,360 3,799 4,418 5,120 5,770 6,431 4,655 5,114 5,921 6,792 7,625 8,537 Net Working Capital 61,755 28,367 31,906 35,823 40,260 45,147 Increase in Net Working Capital (33,388) 3,539 3,917 4,437 4,887 TABLE 19.15 SPREADSHEET Continuation Value Estimate for ldeko Continuation Value: Multiples Approach ($ 000) 1 EBITDA in 2010 32,094 2 EBITDA multiple 9.1x 3 Continuation Enterprise Value 292,052 4 Debt (120,000) 5 Continuation Equity Value 172,052 Common Multiples EV/Sales P/E dlevered) P/E (unlevered) 1.8% 16.3x 18.4x Estimated 2005 Balance Sheet Data for Ideko Corporation Balance Sheet ($ 000) Assets Cash and Equivalents 6,164 Accounts Receivable 53,900 Inventories 6,165 Total Current Assets 66,229 Property, Plant, and Equipment 53,900 Goodwill 72,332 Total Assets 192,461 Liabilities and Stockholders' Equity Accounts Payable Debt Total Liabilities Stockholders' Equity Total Liabilities and Equity 4,654 100,000 104,654 87,807 192,461 Free Cash Flow ($ 000) 2005 2006 2007 2008 2009 2010 Net Income 3,797 4,470 5,713 7,760 8,559 4,388 4,388 4,388 4,388 4,388 Plus: After-tax Interest Expense Unlevered Net Income Plus: Depreciation 8,185 8,858 10,101 12,148 12,947 5,870 5,763 5,667 5,580 6,912 Less: Increase in NWC 33,388 (3,539) (4,800) (3,917) (4,800) (4,437) (4,800) Less: Capital Expenditures (4,800) (4,887) (18,900) (3,928) Free Cash Flow of Firm 42,643 6,282 7,051 8,491 Plus: Net Borrowing 14,100 Less: After-tax Interest Expense (4,388) (4,388) (4,388) (4,388) (4,388) Free Cash Flow to Equity 38,255 1,894 2,663 2,663 5,784