

Answered step by step
Verified Expert Solution
Question
1 Approved Answer
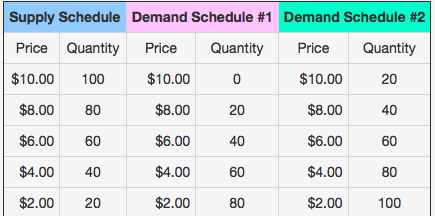
Given the schedules for supply and demand #1 shown below: plot, draw, and label supply and demand curves and estimate Pe and Qe. if the
Given the schedules for supply and demand #1 shown below:
- plot, draw, and label supply and demand curves and estimate Pe and Qe.
- if the government sets a price floor for this product at $8, what will the result be? Illustrate the price floor on your graph and describe the result as precisely as possible.
- if the government reverses itself and places a price ceiling on this product at $4, show the price ceiling on your graph and precisely describe the result.
- if Demand Schedule #1 shifts to Schedule #2, what will the equilibrium values for Pe and Qe become? What could have caused such a shift?
Step by Step Solution
There are 3 Steps involved in it
Step: 1

Get Instant Access to Expert-Tailored Solutions
See step-by-step solutions with expert insights and AI powered tools for academic success
Step: 2

Step: 3
Ace Your Homework with AI
Get the answers you need in no time with our AI-driven, step-by-step assistance
Get Started
Lectures On Urban Economics
Authors: Jan K Brueckner
1st Edition
0262300311, 9780262300315