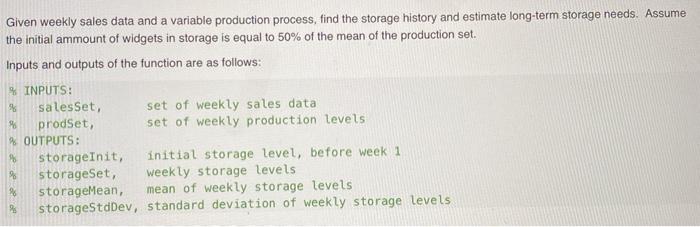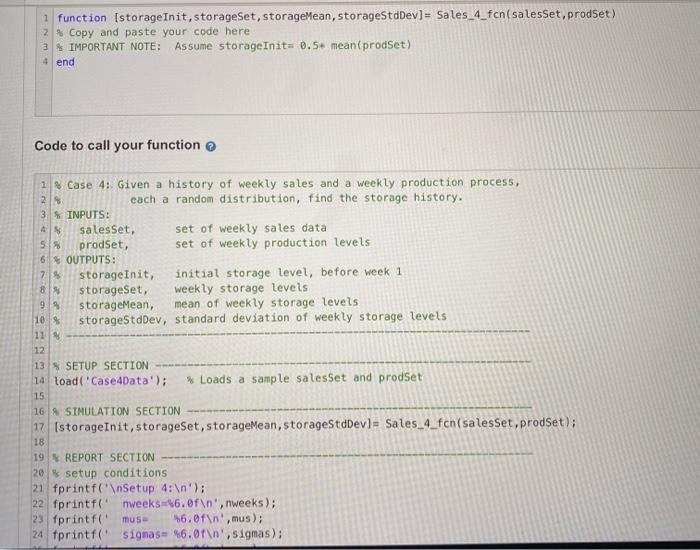
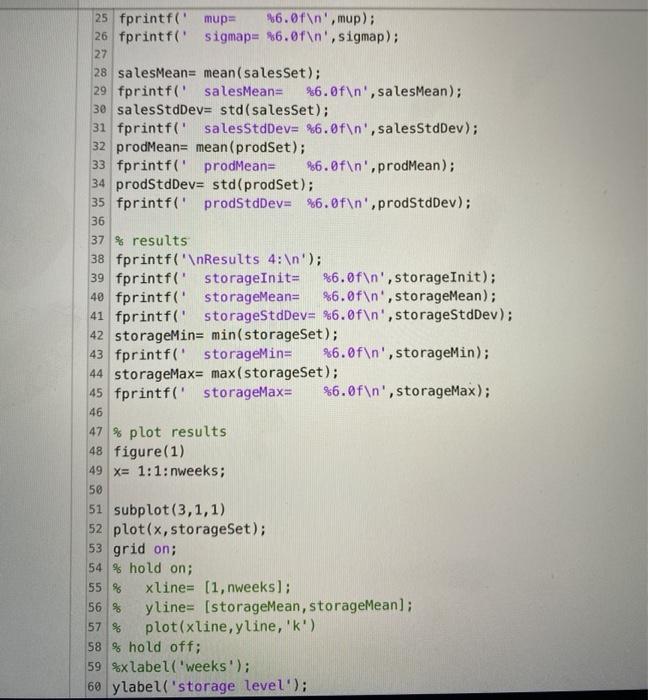
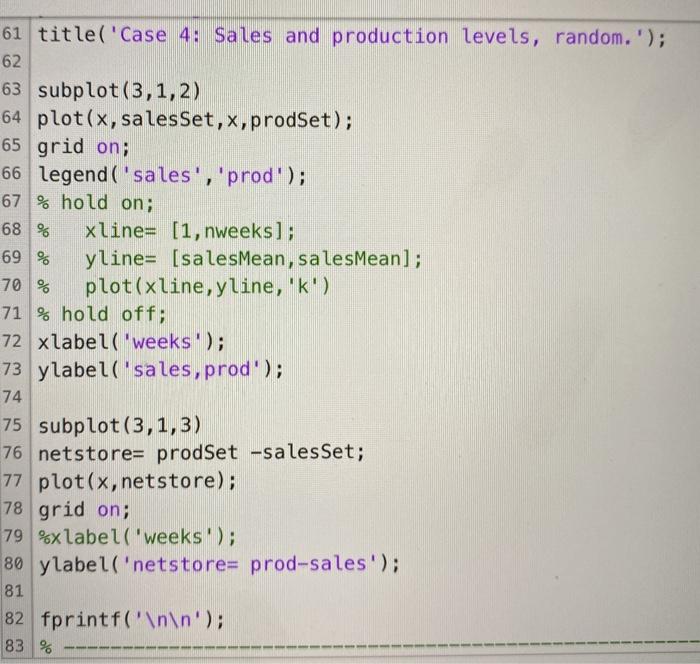

Given weekly sales data and a variable production process, find the storage history and estimate long-term storage needs. Assume the initial ammount of widgets in storage is equal to 50% of the mean of the production set. Inputs and outputs of the function are as follows: % INPUTS: salesset, set of weekly sales data % prodSet, set of weekly production levels % OUTPUTS: storageInit, initial storage level, before week 1 storageSet, weekly storage levels storageMean, mean of weekly storage levels storageStdDev, standard deviation of weekly storage levels 1 function (storage Init, storageSet, storageMean, storageStdDev]= Sales_4_fcn(salesSet, prodSet) 2 % Copy and paste your code here Assume storage Init: 0.5+ mean(prodSet) 3 IMPORTANT NOTE: end Code to call your function 1 x Case 4: Given a history of weekly sales and a weekly production process, 28 each a random distribution, find the storage history. 3 INPUTS: 4 salesset, set of weekly sales data 5 prodset, set of weekly production levels 6 OUTPUTS: 7% storage Init, initial storage level, before week 1 8 storageSet, weekly storage levels 99 storageMean, mean of weekly storage levels 10% storageStdDev, standard deviation of weekly storage levels 11 12 13 SETUP SECTION 14 load('Case4Data'); Loads a sample salesSet and prodset 15 16 A SIMULATION SECTION 17 (storageInit.storageSet, storageMean, storageStdDev)= Sales_4_fcn(salesset, prodSet); 18 19 REPORT SECTION 20 setup conditions 21 fprintf(' Setup 4: '); 22 fprintfinweeks 6.0f ', nweeks); 23 fprintf(mus 16.0f ', mus); 24 fprintf("sigmas= 26.07 ', sigmas); 25 fprintf('mup 6.0f ', mup); 26 fprintf(' sigmap= %6.0f ', sigmap); 27 28 salesMean= mean(salesSet); 29 fprintf('salesMean= %6.0f ', salesMean); 30 salesStdDev= std(salesSet); 31 fprintf('salesStdDev= %6.0f ', salesStdDev); 32 prodMean= mean(prodSet); 33 fprintf('prodMean= %6.0f ', prodMean); 34 prodStdDev= std(prodSet); 35 fprintf('prodStdDev= %6.0f ', prodStdDev); 36 37 % results 38 fprintf(' Results 4: '); 39 fprintf(storageInit= %6.0f ', storage Init); 40 fprintf(storageMean= %6.0f ", storageMean); 41 fprintf("storageStdDev= %6.0f ', storageStdDev); 42 storageMin= min(storageSet); 43 fprintf(storageMin= %6.0f ', storageMin); 44 storageMax= max(storageSet); 45 fprintf(' storageMax= %6.0f ', storageMax); 46 47 % plot results 48 figure(1) 49 x= 1:1:nweeks; 50 51 subplot(3,1,1) 52 plot(x, storageSet); 53 grid on; 54 % hold on; 55 % xline= (1, nweeks); 56 % yline= (storageMean, storageMean); 57 % plot(xline,yline, 'k') 58 % hold off; 59 %xlabel('weeks'); 60 ylabel('storage level'); 61 title('Case 4: Sales and production levels, random.'); 62 63 subplot(3,1,2) 64 plot(x, salesSet,x,prodSet); 65 grid on; 66 legend('sales', 'prod'); 67 % hold on; 68 % xline= [1, nweeks); 69 % yline= (salesMean, salesMean]; 70 % plot(xline,yline, 'k') 71 % hold off; 72 xlabel('weeks'); 73 ylabel('sales,prod'); 74 75 subplot(3,1,3) 76 netstore= prodSet -salesSet; 77 plot(x, netstore); 78 grid on; 79 %xlabel('weeks'); 80 ylabel('netstore= prod-sales'); 81 82 fprintf(' '); 83 % IMPORTANT NOTES: All standard deviations should be calculated as if we are measuring the entire population, not a subsample. Thus standard deviation is found by the equation: - )