

Answered step by step
Verified Expert Solution
Question
1 Approved Answer
g-j please 5 Beerco manufactures ale and beer from corn, hops, and malt. Currently, 40 lb of corn, 30 lb of hops, and 40 lb
g-j please
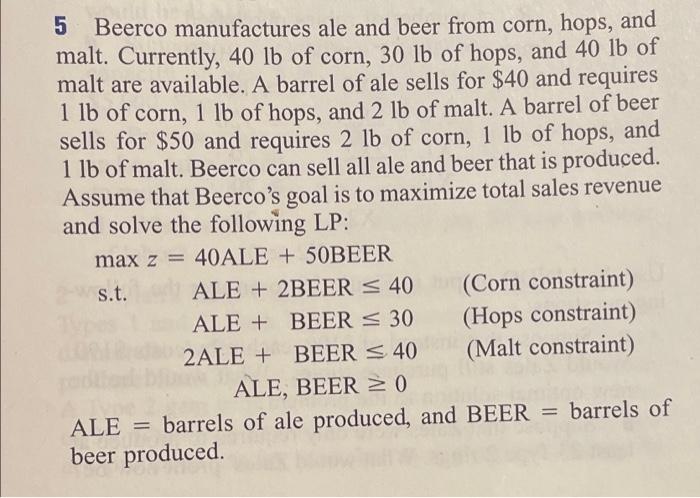
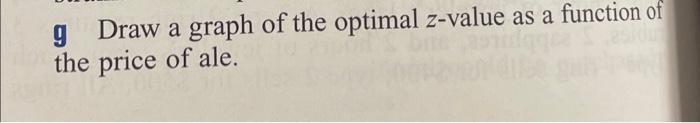
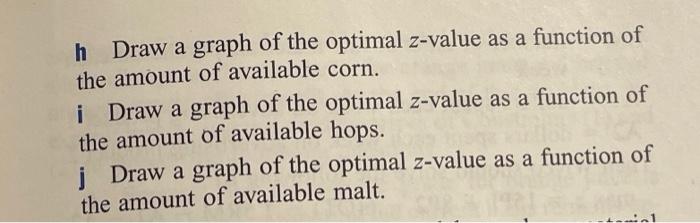
5 Beerco manufactures ale and beer from corn, hops, and malt. Currently, 40 lb of corn, 30 lb of hops, and 40 lb of malt are available. A barrel of ale sells for $40 and requires 1 lb of corn, 1 lb of hops, and 2 lb of malt. A barrel of beer sells for $50 and requires 2 lb of corn, 1 lb of hops, and 1 lb of malt. Beerco can sell all ale and beer that is produced. Assume that Beerco's goal is to maximize total sales revenue and solve the following LP: max z = 40ALE + 50BEER s.t. ALE + 2BEER = 40 (Corn constraint) ALE + BEER = 30 (Hops constraint) 2ALE + BEER 0 ALE = barrels of ale produced, and BEER = barrels of beer produced. g Draw a graph of the optimal z-value as a function of the price of ale. h Draw a graph of the optimal z-value as a function of the amount of available corn. i Draw a graph of the optimal z-value as a function of the amount of available hops. i Draw a graph of the optimal z-value as a function of the amount of available malt. 5 Beerco manufactures ale and beer from corn, hops, and malt. Currently, 40 lb of corn, 30 lb of hops, and 40 lb of malt are available. A barrel of ale sells for $40 and requires 1 lb of corn, 1 lb of hops, and 2 lb of malt. A barrel of beer sells for $50 and requires 2 lb of corn, 1 lb of hops, and 1 lb of malt. Beerco can sell all ale and beer that is produced. Assume that Beerco's goal is to maximize total sales revenue and solve the following LP: max z = 40ALE + 50BEER s.t. ALE + 2BEER = 40 (Corn constraint) ALE + BEER = 30 (Hops constraint) 2ALE + BEER 0 ALE = barrels of ale produced, and BEER = barrels of beer produced. g Draw a graph of the optimal z-value as a function of the price of ale. h Draw a graph of the optimal z-value as a function of the amount of available corn. i Draw a graph of the optimal z-value as a function of the amount of available hops. i Draw a graph of the optimal z-value as a function of the amount of available malt Step by Step Solution
There are 3 Steps involved in it
Step: 1

Get Instant Access to Expert-Tailored Solutions
See step-by-step solutions with expert insights and AI powered tools for academic success
Step: 2

Step: 3
Ace Your Homework with AI
Get the answers you need in no time with our AI-driven, step-by-step assistance
Get Started
Clinical Audit In Mental Health Toward A Multidisciplinary Approach
Authors: John Riordan, Darren Mockler
1st Edition
0471963321, 978-0471963325