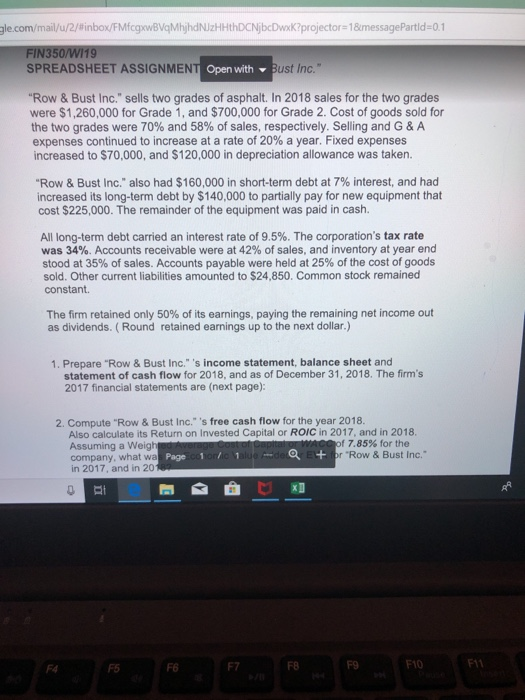
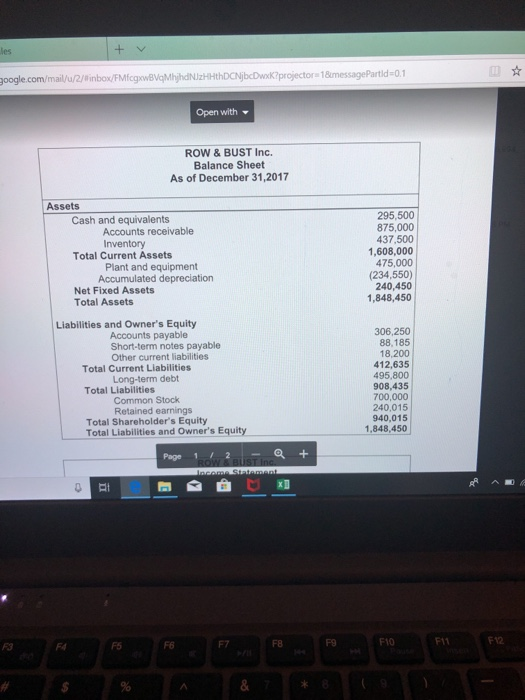
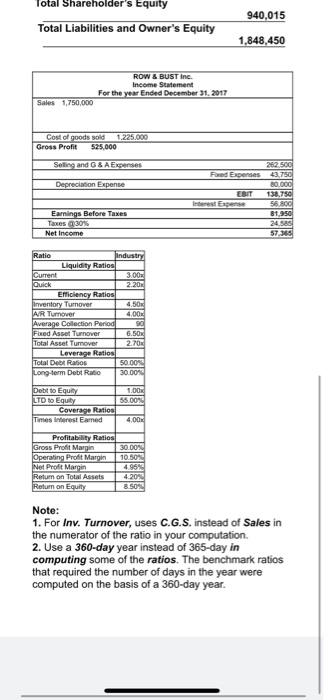
gle.com/mail/u/2/Binbox/FMfcgwBVqMhjhdNJzHHthDCNjbcDwxk?projector 18messagePartld-0.1 SPREADSHEET ASSIGNMENT ASSIGNMENT Open with ust Inc." Row&Bust Inc." sells two grades of asphalt. In 2018 sales for the two grades were $1,260,000 for Grade 1, and $700,000 for Grade 2. Cost of goods sold for the two grades were 70% and 58% of sales, respectively. Selling and G & A expenses continued to increase at a rate of 20% a year. Fixed expenses increased to $70,000, and $120,000 in depreciation allowance was taken. "Row & Bust Inc." also had $160,000 in short-term debt at 7% interest, and had increased its long-term debt by $140,000 to partially pay for new equipment that cost $225,000. The remainder of the equipment was paid in cash. All long-term debt carried an interest rate of 9.5%. The corporation's tax rate was 34%. Accounts receivable were at 42% of sales, and inventory at year end stood at 35% of sales. Accounts payable were held at 25% of the cost of goods sold. Other current liabilities amounted to $24,850. Common stock remained constant. The firm retained only 50% of its earnings, paying the remaining net income out as dividends. (Round retained earnings up to the next dollar.) 1. Prepare "Row & Bust Inc." 's income statement, balance sheet and statement of cash flow for 2018, and as of December 31, 2018. The firm's 2017 financial statements are (next page): 2. Compute "Row & Bust Inc." 's free cash flow for the year 2018. Also calculate its Return on Invested Capital or ROIC in 2017, and in 2018 Assuming a Weig company, what wa in 2017, and in 20 17.85% for the Page co1ortic alue Et or "Row& Bust Inc. 0 F4 F5 F6 F8 F9 google.com/mail//2/Wnbo/FMfcgowBVgMhijhdNUJzHHthDCNjbcDwxkprojector 18messagePartid-0.1 Open with ROW & BUST Inc. Balance Sheet As of December 31,2017 Assets 295,500 875,000 437,500 1,608,000 475,000 (234,550) 240,450 1,848,450 Cash and equivalents Accounts receivable Total Current Assets Plant and equipment Accumulated depreciation Net Fixed Assets Total Assets Liabilities and Owner's Equity 306,250 88,185 18,200 412,635 495,800 908,435 700,000 240,015 940,015 1,848,450 Accounts payable Short-term notes payable Other current liabilities Total Current Liabilities Long-term debt Common Stock Retained earnings Total Liabilities Total Shareholder's Equity Total Liabilities and Owner's Equity Page 1 /2+ e n Total Shareholder's Equity 940.015 Total Liabilities and Owner's Equity 1,848.450 ROW & BUST Inc. For the Ended December 31. 2017 Sales 1,750,000 Cost of Gross Profit sold 1.225.000 525,000 ESIT 138 nterest E Taxes @ 0% 57 2.20 xed Asset Asset T Debt Ratio 30 mes leterest Eamed 4.95 on Total Assets Note: 1. For Inv. Turnover, uses C.G.S. instead of Sales in the numerator of the ratio in your computation. 2. Use a 360-day year instead of 365-day in computing some of the ratios. The benchmark ratios that required the number of days in the year were computed on the basis of a 360-day year