Answered step by step
Verified Expert Solution
Question
1 Approved Answer
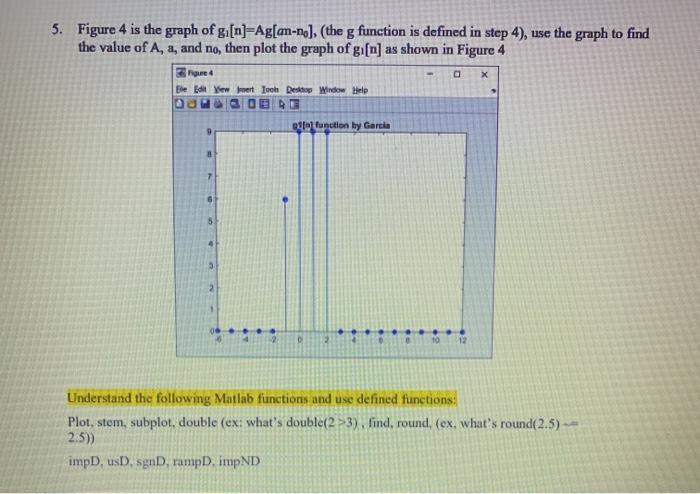
g[n]=2(u[n-2]-u[n-4])+3*(u[n-4]-u[n-9]) 5. Figure 4 is the graph of g1 [n]-Ag[an-no], (the g function is defined in step 4), use the graph to find the value
g[n]=2(u[n-2]-u[n-4])+3*(u[n-4]-u[n-9]) 
5. Figure 4 is the graph of g1 [n]-Ag[an-no], (the g function is defined in step 4), use the graph to find the value of A, a, and no, then plot the graph of gi[n] as shown in Figure 4 Figure Ele Edit View Tech Desktop Window Help eft function by Garcia 8 3 2 D 10 12 Understand the following Matlab functions and use defined functions: Plot, stem, subplot, double (ex: what's double(2>3), lind, round, (ex, what's round(2.5) -- 2.5)) imp. usDsgnD, ramp. impND 
Step by Step Solution
There are 3 Steps involved in it
Step: 1

Get Instant Access to Expert-Tailored Solutions
See step-by-step solutions with expert insights and AI powered tools for academic success
Step: 2

Step: 3

Ace Your Homework with AI
Get the answers you need in no time with our AI-driven, step-by-step assistance
Get Started


