

Answered step by step
Verified Expert Solution
Question
1 Approved Answer
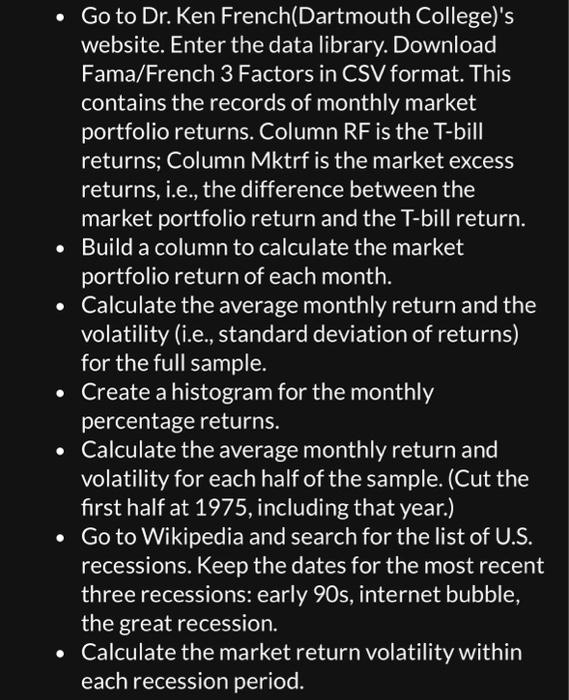
- Go to Dr. Ken French(Dartmouth College)'s website. Enter the data library. Download Fama/French 3 Factors in CSV format. This contains the records of monthly
Step by Step Solution
There are 3 Steps involved in it
Step: 1

Get Instant Access to Expert-Tailored Solutions
See step-by-step solutions with expert insights and AI powered tools for academic success
Step: 2

Step: 3
Ace Your Homework with AI
Get the answers you need in no time with our AI-driven, step-by-step assistance
Get Started
Sam Bankman Fried
Authors: Evelyn Everlore
1st Edition
979-8866401925