Question
Granite Life Brenda Castro is an Events Coordinator for the Granite Life insurance company. One event that the company sponsors is a three-day educational seminar
Granite Life Brenda Castro is an Events Coordinator for the Granite Life insurance company. One event that the company sponsors is a three-day educational seminar on insurance and investing, which will take place in Provo, Utah, this year. Brenda wants to estimate the number of attendees and predict the net income from the event. Complete the following:
1. Open the NP_EX_8-3.xlsx workbook located in the Excel8 > Case1 folder included with your Data Files. Save the workbook as NP_EX_8_Seminar in the location specified by your instructor.
2. In the Documentation sheet, enter your name and the date.
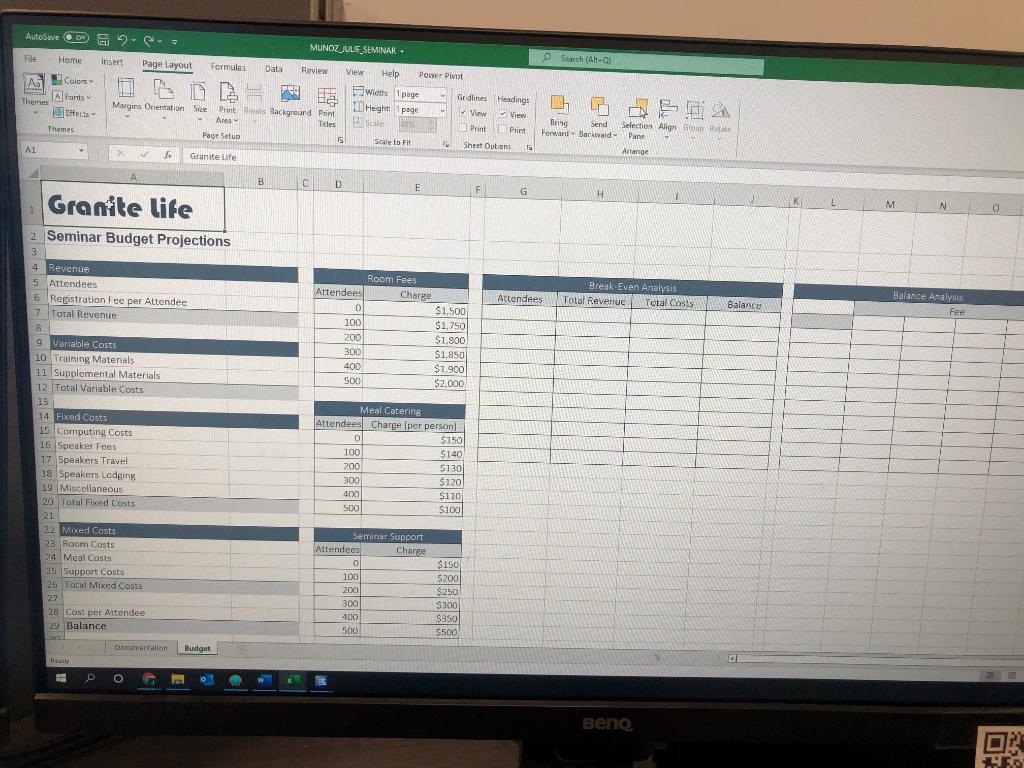
3. Brenda wants to calculate a budget that assumes 200 people will attend the seminar at a cost of $500 per person. In the Budget worksheet, enter these values in the range B5:B6. In cell B7, cal-culate the total revenue from attendance at the seminar by multiplying the number of attendees and the registration fee per attendee.
4. Each attendee will receive training materials costing $150 and supplementary materials costing $75. Enter these values into the range B10:B11. In cell B12, calculate the total variable costs by multiplying the cost of the materials by the number of attendees.
5. In the range B15:B19, enter the fixed costs associated with the seminar. Providing computers and networking support for the entire seminar will cost $1,400. The speakers at the seminar will cost $2,400 for their fees, $2,000 for their travel, and $950 for their lodging. Brenda estimates $5,000 in miscellaneous expenses. In cell B20, calculate sum of these fixed costs.
6. The company must rent conference rooms large enough to accommodate the number of attendees. The lookup table in the range D5:E11 contains the room charges for seminars of in groups of 100 from 0 up to 500 or more. For example, to accommodate 0 to 100 people will cost the company $1,500. In cell B23, calculate the room costs by looking up the room rental fee based on the number of attendees (cell B5). (Hint: Use the VLOOKUP function with an approximate match lookup for the values the Room_Lookup table.)
7. The more attendees, the less the hotel will charge per person to cater the seminar meals. In cell B24, calculate the total catering charge by using the lookup table named Meal_Lookup to determine the cost per person, and then multiply that value by the number of attendees entered in cell B5.
8. The company also pays for seminar support staff. The larger the seminar, the higher the support staff fee. The lookup table in the range D23:E29 contains the staff fees for groups of different sizes. For example, a seminar of 0 to 100 people will incur a $150 staff fee. In cell B25, calculate the support costs for the number of attendees to the seminar using the VLOOKUP table with the values in the Seminar_Lookup range.
9. In cell B26, calculate the total mixed costs by adding the room, meal, and support costs.
10. In cell B28, calculate the cost per attendee by dividing the sum of the variable costs (cell B12), fixed costs (cell B20), and mixed costs (cell B26) by the number of attendees (cell B5).
11. In cell B29, calculate the balance from the conference by subtracting the sum of the variable, fixed, and mixed costs from the total revenue (cell B7).
12. Create a one-variable data table of different seminar budgets. In cell G6, display the value of cell B5. In cell H6, display the value of B7. In cell I6, display the sum of cells B12, B20, and B26. In cell J6, display the value of cell B29. In the range G7:G16, enter the number of possible attendees ranging from 50 to 500 in increments of 50. Complete the data table with cell B5 as the column input cell, showing the total revenue, total costs, and balance under different numbers of attendees.
13. Create a CVP chart of the Total Revenue and Total Costs values using the data from the range G5:I16, the one-variable table, and then format the chart as follows:a. Move and resize the chart to cover the range G18:J29.b. Change the chart title to CVP Analysis.c. Change the scale of the horizontal axis to go from 0 to 500 in 100-unit increments.
14. Brenda wants to investigate the impact of different registration fees and number of attendees on the seminar balance. In cell L6, display the value of cell B29 formatted to display the text Attendees. In the range L7:L16, enter attendee values ranging from 50 to 500 in increments of 50. In the range M6:P6, enter registration fees of $200, $300, $400, and $500.
15. Create a two-variable data table in the range L6:P16, using cell B6 as the row input cell and cell B5 as the column input cell.
16. Create a scatter chart with straight lines of the data in the range L7:P16, and then make the fol-lowing changes to the chart:a. Move and resize the chart to cover the range L18:P29.b. Change the chart title to Balance Analysis.c. Change the name of the four data series to match the registration fee values in cells M6, N6, O6, and P6.d. Change the scale of the horizontal axis to go from 0 to 500 in 100-unit increments.
17. Create scenarios for the other possible values for the input cells listed in Figure 848.
| CHANGING CELL | SEMINAR 1 | SEMINAR 2 | SEMINAR 3 |
|---|---|---|---|
| Attendees | 200 | 300 | 150 |
| Registration Fee | $500 | $400 | $600 |
| Training Materials | $150 | $175 | $135 |
| Supplemental Materials | $75 | $100 | $55 |
| Computing Costs | $1400 | $1200 | $1600 |
| Speaker Fees | $2400 | $2800 | $2600 |
| Speakers Travel | $2000 | $2200 | $1600 |
| Speakers Lodging | $950 | $1200 | $1000 |
| Miscellaneous | $5000 | $4500 | $4800 |
18. Create a scenario summary report of the Seminar 1, Seminar 2, and Seminar 3 scenarios, show-ing the cost per person and balance from each seminar as the result. Move the sheet to the end of the workbook.
19. Show the results of Scenario 3 in the Budget worksheet.
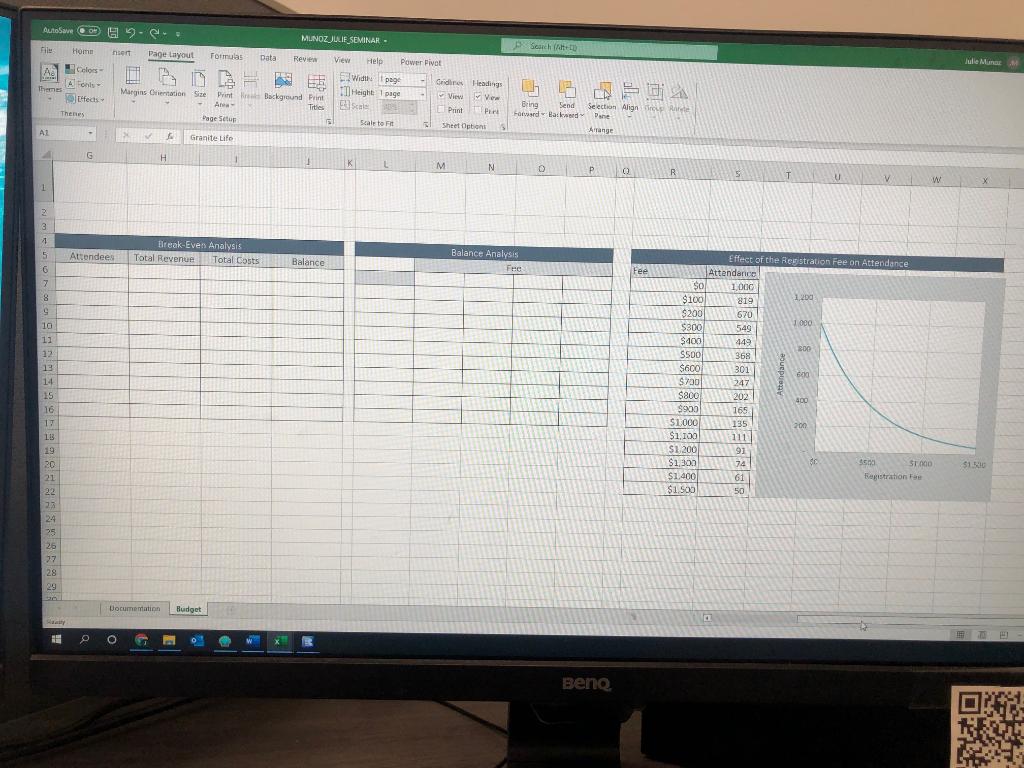
20. Experience has taught Brenda that as the registration fee for the seminar increases, the number of attendees willing to pay decreases. Based data from other seminars, Brenda has defined a relationship between attendance and registration fee, shown in the range R4:X21 on the Budget worksheet. In cell B5 of the Budget worksheet, change the number of attendees from a constant value to the following formula that projects the number of attendees for a given registration fee based on the value in cell B6. (Hint: Look at the formulas in the range S6:S21 to learn how to translate this equation into an Excel formula.) Attendees = 1000 e(fee/75)
21. Use Solver to determine the registration fee in cell B6 that will maximize the balance value in cell B29 with the constraint that the registration fee should be an integer. Run Solver with an initial registration fee of $1,000.


Step by Step Solution
There are 3 Steps involved in it
Step: 1

Get Instant Access to Expert-Tailored Solutions
See step-by-step solutions with expert insights and AI powered tools for academic success
Step: 2

Step: 3

Ace Your Homework with AI
Get the answers you need in no time with our AI-driven, step-by-step assistance
Get Started


