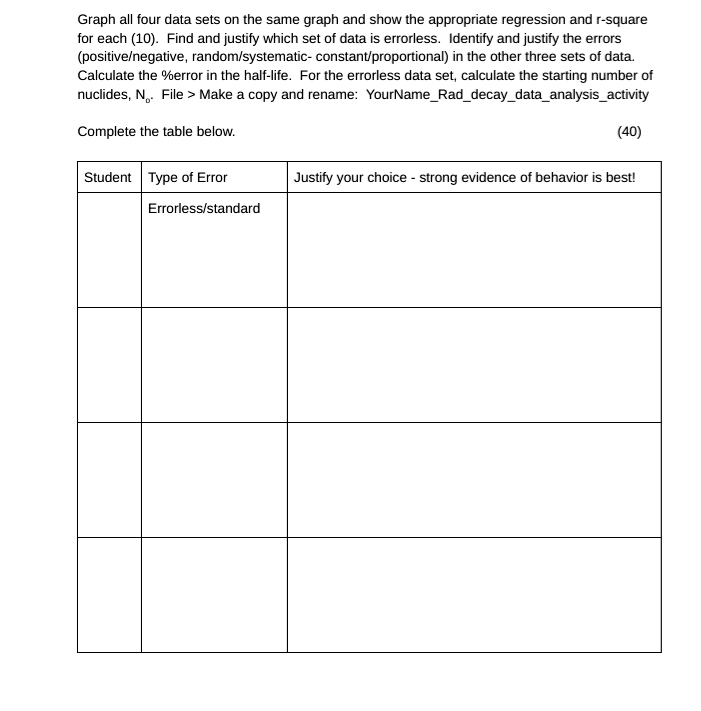
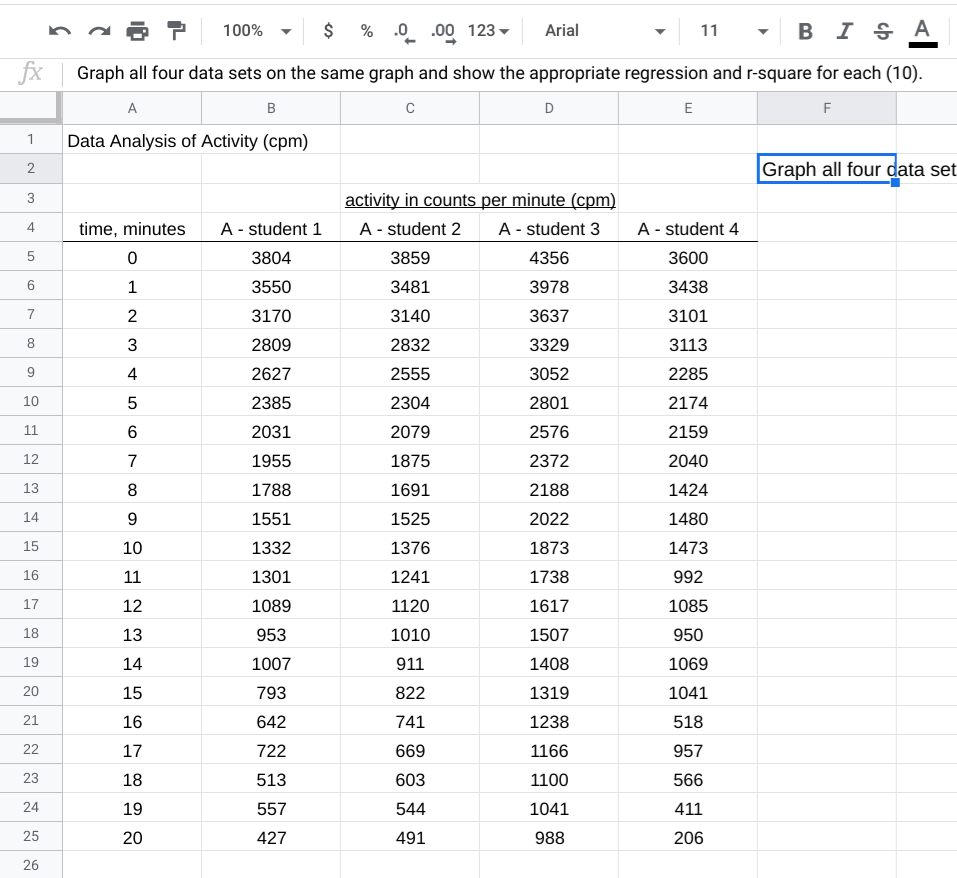
Graph all four data sets on the same graph and show the appropriate regression and r-square for each (10). Find and justify which set of data is errorless. Identify and justify the errors (positiveegative, random/systematic- constant/proportional) in the other three sets of data. Calculate the %error in the half-life. For the errorless data set, calculate the starting number of nuclides, N. File > Make a copy and rename: YourName_Rad_decay_data_analysis_activity Complete the table below. (40) Student Type of Error Justify your choice - strong evidence of behavior is best! Errorless/standard n fx a 100% $ % .0 .00 123 Arial - 11 - BI & A Graph all four data sets on the same graph and show the appropriate regression and r-square for each (10). 1 Data Analysis of Activity (cpm) Graph all four data set time, minutes A - student 1 W NPO 000 3804 3550 3170 2809 2627 2385 2031 1955 1788 1551 1332 1301 1089 953 1007 793 642 722 513 557 427 activity in counts per minute (cpm) A-student 2 A - student 3 3859 4356 3481 3978 3140 3637 2832 3329 2555 3052 2304 2801 2079 2576 1875 2372 1691 2188 1525 2022 1376 1873 1241 1738 1120 1617 1010 1507 911 1408 822 1319 741 1238 669 1166 603 1100 544 1041 491 988 A-student 4 3600 3438 3101 3113 2285 2174 2159 2040 1424 1480 1473 992 1085 950 1069 1041 518 957 566 411 15 206 Graph all four data sets on the same graph and show the appropriate regression and r-square for each (10). Find and justify which set of data is errorless. Identify and justify the errors (positiveegative, random/systematic- constant/proportional) in the other three sets of data. Calculate the %error in the half-life. For the errorless data set, calculate the starting number of nuclides, N. File > Make a copy and rename: YourName_Rad_decay_data_analysis_activity Complete the table below. (40) Student Type of Error Justify your choice - strong evidence of behavior is best! Errorless/standard n fx a 100% $ % .0 .00 123 Arial - 11 - BI & A Graph all four data sets on the same graph and show the appropriate regression and r-square for each (10). 1 Data Analysis of Activity (cpm) Graph all four data set time, minutes A - student 1 W NPO 000 3804 3550 3170 2809 2627 2385 2031 1955 1788 1551 1332 1301 1089 953 1007 793 642 722 513 557 427 activity in counts per minute (cpm) A-student 2 A - student 3 3859 4356 3481 3978 3140 3637 2832 3329 2555 3052 2304 2801 2079 2576 1875 2372 1691 2188 1525 2022 1376 1873 1241 1738 1120 1617 1010 1507 911 1408 822 1319 741 1238 669 1166 603 1100 544 1041 491 988 A-student 4 3600 3438 3101 3113 2285 2174 2159 2040 1424 1480 1473 992 1085 950 1069 1041 518 957 566 411 15 206