graph the cash flows manually
 Engineering economy
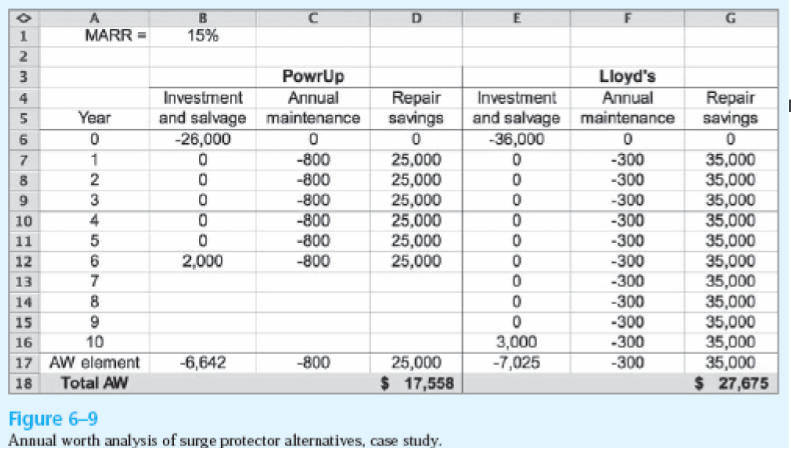
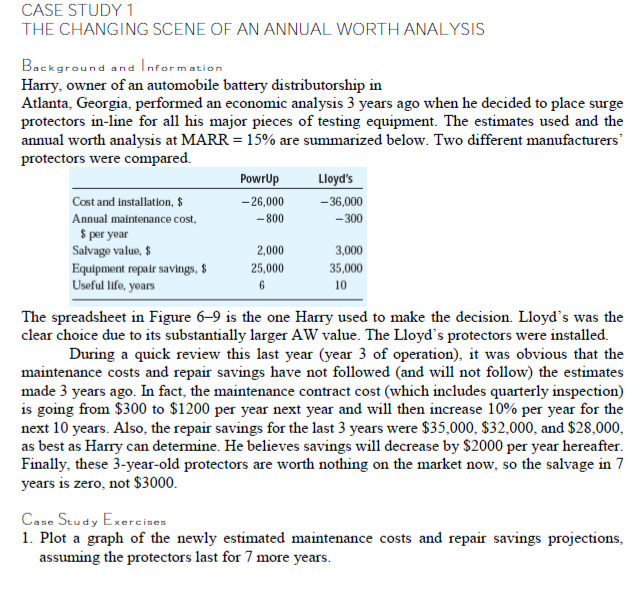
G LA 1 1 MARR = 15% 2 3 Powrup 4 Investment Annual Repair Year and salvage maintenance savings 6 0 -26,000 0 0 7 0 -800 25,000 8 2 0 -800 25,000 9 3 0 -800 25,000 10 4 0 -800 25,000 11 5 0 -800 25,000 6 2,000 -800 25,000 13 7 14 8 15 9 16 10 17 AW element -6,642 -800 25,000 18 Total AW $ 17,558 Figure 6-9 Annual worth analysis of surge protector alternatives, case study. Lloyd's Investment Annual and salvage maintenance -36,000 0 0 -300 0 -300 0 -300 0 -300 0 -300 0 -300 0 -300 0 -300 0 -300 3,000 -300 -7,025 -300 Repair savings 0 35,000 35,000 35,000 35,000 35,000 35,000 35,000 35,000 35,000 35,000 35,000 $ 27,675 12 CASE STUDY 1 THE CHANGING SCENE OF AN ANNUAL WORTH ANALYSIS Background and Information Harry, owner of an automobile battery distributorship in Atlanta, Georgia, performed an economic analysis 3 years ago when he decided to place surge protectors in-line for all his major pieces of testing equipment. The estimates used and the annual worth analysis at MARR = 15% are summarized below. Two different manufacturers protectors were compared. PowrUp Lloyd's Cost and installation, $ -26,000 - 36,000 Annual maintenance cost -800 - 300 $ per year Salvage value, $ 2,000 3,000 Equipment repair savings, $ 25,000 35,000 Useful life, years 6 10 The spreadsheet in Figure 6-9 is the one Harry used to make the decision. Lloyd's was the clear choice due to its substantially larger AW value. The Lloyd's protectors were installed. During a quick review this last year (year 3 of operation), it was obvious that the maintenance costs and repair savings have not followed (and will not follow) the estimates made 3 years ago. In fact, the maintenance contract cost (which includes quarterly inspection) is going from $300 to $1200 per year next year and will then increase 10% per year for the next 10 years. Also, the repair savings for the last 3 years were $35,000, $32,000, and $28,000, as best as Harry can determine. He believes savings will decrease by $2000 per year hereafter. Finally, these 3-year-old protectors are worth nothing on the market now, so the salvage in 7 years is zero, not $3000. Case Study Exercises 1. Plot a graph of the newly estimated maintenance costs and repair savings projections, assuming the protectors last for 7 more years. G LA 1 1 MARR = 15% 2 3 Powrup 4 Investment Annual Repair Year and salvage maintenance savings 6 0 -26,000 0 0 7 0 -800 25,000 8 2 0 -800 25,000 9 3 0 -800 25,000 10 4 0 -800 25,000 11 5 0 -800 25,000 6 2,000 -800 25,000 13 7 14 8 15 9 16 10 17 AW element -6,642 -800 25,000 18 Total AW $ 17,558 Figure 6-9 Annual worth analysis of surge protector alternatives, case study. Lloyd's Investment Annual and salvage maintenance -36,000 0 0 -300 0 -300 0 -300 0 -300 0 -300 0 -300 0 -300 0 -300 0 -300 3,000 -300 -7,025 -300 Repair savings 0 35,000 35,000 35,000 35,000 35,000 35,000 35,000 35,000 35,000 35,000 35,000 $ 27,675 12 CASE STUDY 1 THE CHANGING SCENE OF AN ANNUAL WORTH ANALYSIS Background and Information Harry, owner of an automobile battery distributorship in Atlanta, Georgia, performed an economic analysis 3 years ago when he decided to place surge protectors in-line for all his major pieces of testing equipment. The estimates used and the annual worth analysis at MARR = 15% are summarized below. Two different manufacturers protectors were compared. PowrUp Lloyd's Cost and installation, $ -26,000 - 36,000 Annual maintenance cost -800 - 300 $ per year Salvage value, $ 2,000 3,000 Equipment repair savings, $ 25,000 35,000 Useful life, years 6 10 The spreadsheet in Figure 6-9 is the one Harry used to make the decision. Lloyd's was the clear choice due to its substantially larger AW value. The Lloyd's protectors were installed. During a quick review this last year (year 3 of operation), it was obvious that the maintenance costs and repair savings have not followed (and will not follow) the estimates made 3 years ago. In fact, the maintenance contract cost (which includes quarterly inspection) is going from $300 to $1200 per year next year and will then increase 10% per year for the next 10 years. Also, the repair savings for the last 3 years were $35,000, $32,000, and $28,000, as best as Harry can determine. He believes savings will decrease by $2000 per year hereafter. Finally, these 3-year-old protectors are worth nothing on the market now, so the salvage in 7 years is zero, not $3000. Case Study Exercises 1. Plot a graph of the newly estimated maintenance costs and repair savings projections, assuming the protectors last for 7 more years
 Engineering economy


