Question
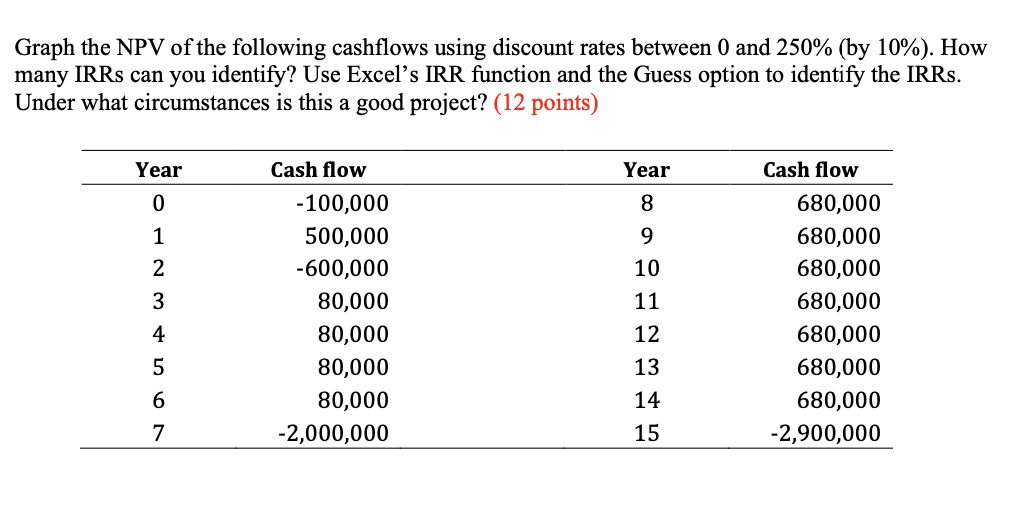
Graph the NPV of the following cashflows using discount rates between 0 and 250% (by 10%). How many IRRs can you identify? Use Excel's

Graph the NPV of the following cashflows using discount rates between 0 and 250% (by 10%). How many IRRs can you identify? Use Excel's IRR function and the Guess option to identify the IRRs. Under what circumstances is this a good project? (12 points) Year 0 1 2 3 4 5 6 7 Cash flow -100,000 500,000 -600,000 80,000 80,000 80,000 80,000 -2,000,000 Year 8 9 10 11 1213415 Cash flow 680,000 680,000 680,000 680,000 680,000 680,000 680,000 -2,900,000
Step by Step Solution
3.43 Rating (156 Votes )
There are 3 Steps involved in it
Step: 1
To graph the Net Present Value NPV of the cash flows and identify the Internal Rate of Return IRR fo...
Get Instant Access to Expert-Tailored Solutions
See step-by-step solutions with expert insights and AI powered tools for academic success
Step: 2

Step: 3

Ace Your Homework with AI
Get the answers you need in no time with our AI-driven, step-by-step assistance
Get StartedRecommended Textbook for
Cost Management A Strategic Emphasis
Authors: Edward Blocher, David F. Stout, Paul Juras, Steven Smith
8th Edition
1259917029, 978-1259917028
Students also viewed these Finance questions
Question
Answered: 1 week ago
Question
Answered: 1 week ago
Question
Answered: 1 week ago
Question
Answered: 1 week ago
Question
Answered: 1 week ago
Question
Answered: 1 week ago
Question
Answered: 1 week ago
Question
Answered: 1 week ago
Question
Answered: 1 week ago
Question
Answered: 1 week ago
Question
Answered: 1 week ago
Question
Answered: 1 week ago
Question
Answered: 1 week ago
Question
Answered: 1 week ago
Question
Answered: 1 week ago
Question
Answered: 1 week ago
Question
Answered: 1 week ago
Question
Answered: 1 week ago
Question
Answered: 1 week ago
Question
Answered: 1 week ago
Question
Answered: 1 week ago
View Answer in SolutionInn App


