Graphs and functions. Function Rules, Tables, and Graphs. Answer questions, Check your understanding 1 and Check your understanding 2 a and b. Check understanding 3,
Graphs and functions.
Function Rules, Tables, and Graphs.
Answer questions, Check your understanding 1 and Check your understanding 2 a and b.
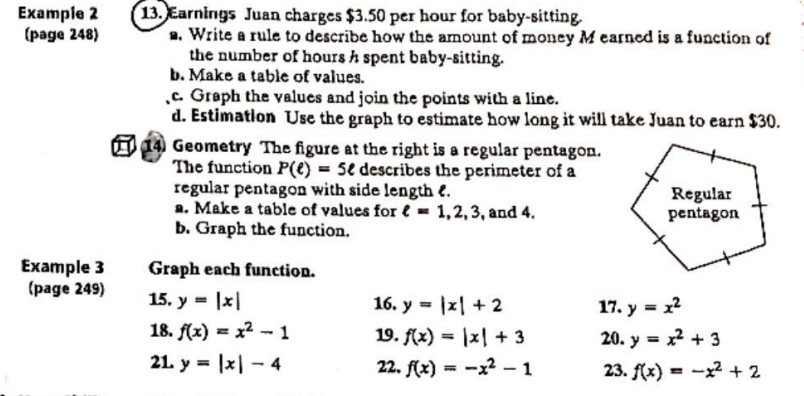
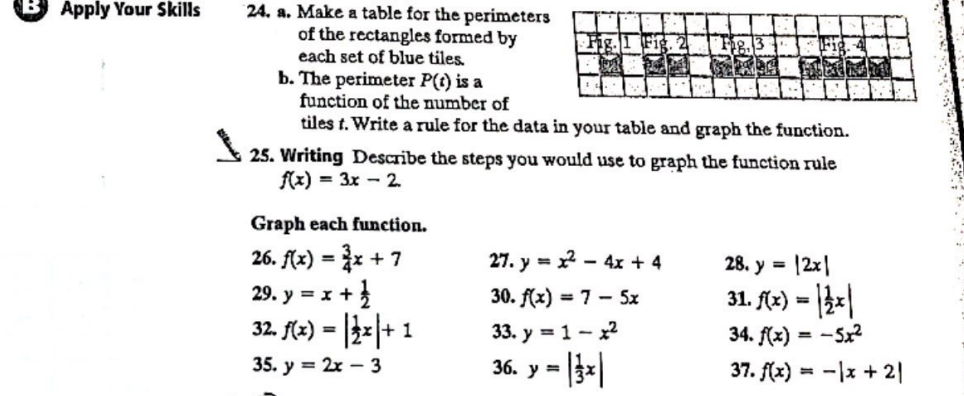
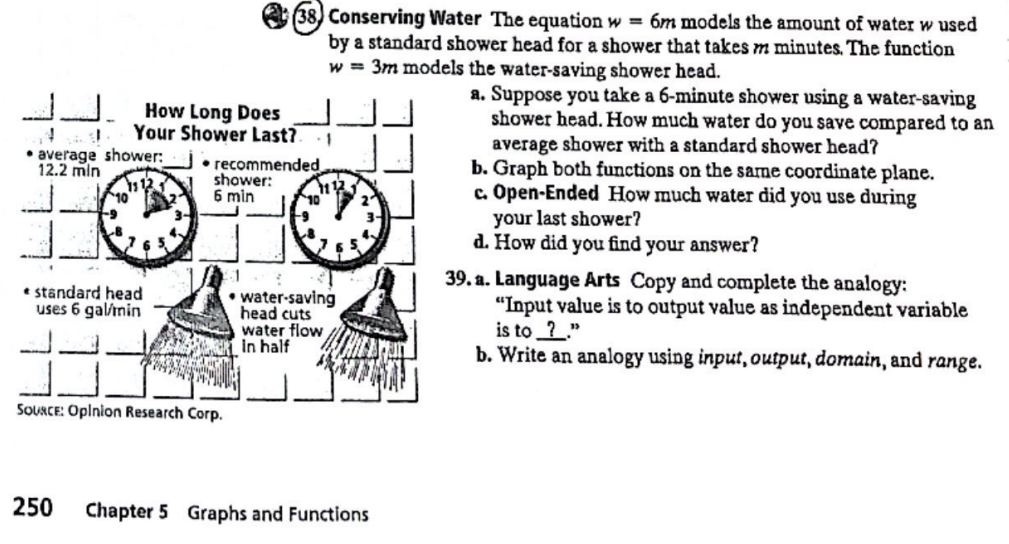
Check understanding 3, Exercises practice and problem-solving 1, 2, 3, 4, 5, 6, 7, 8. 9, 10, 11, 12, example 2, 13 a, b, c, d, 14 Geometry a, b, example 3, 15, 16, 16, 18, 19, 20, 21, 22, 23, 24 a and b, 25, 26, 27, 28, 29, 30, 31, 32, 33, 34, 35, 36, 37, 38 a, b, c, d, 39 a and b.
SHOW YOUR WORK USING THE GRAPHS.
Answer all of the questions, please, and thank you.
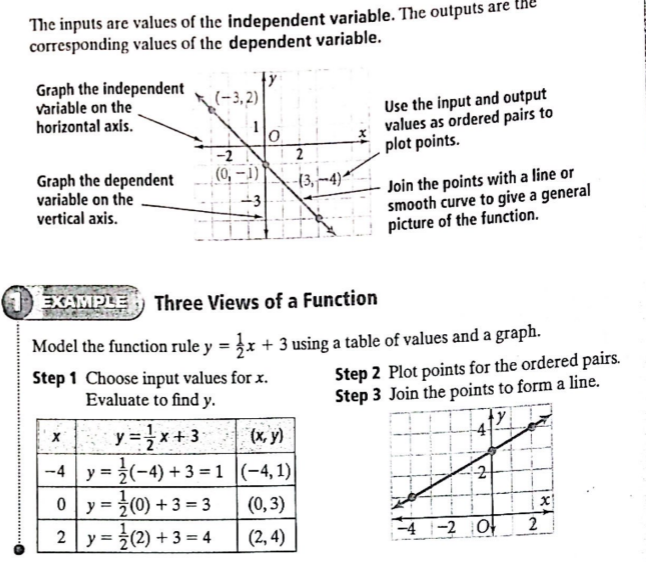
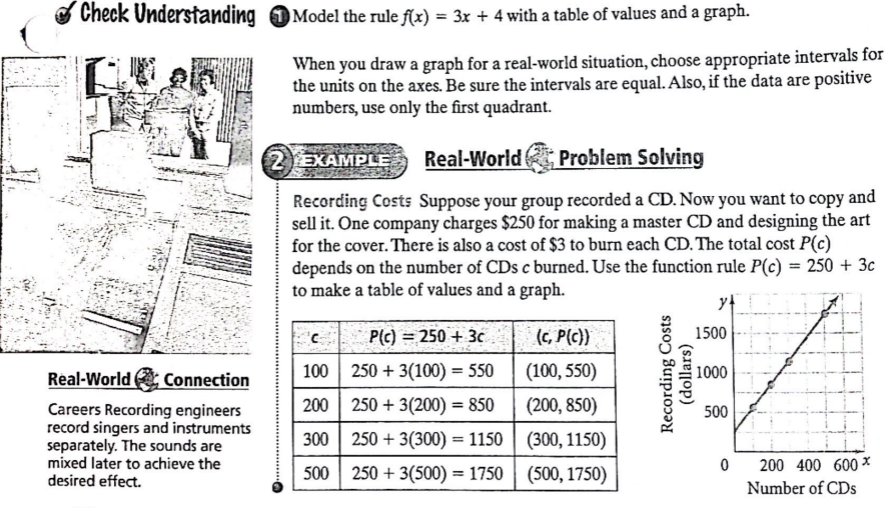
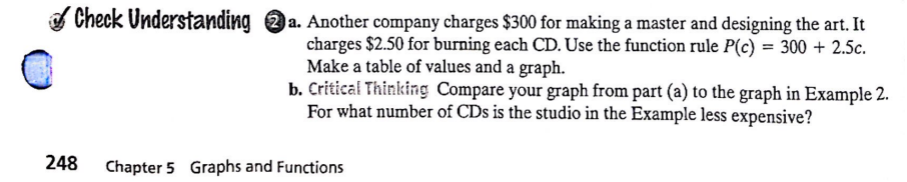
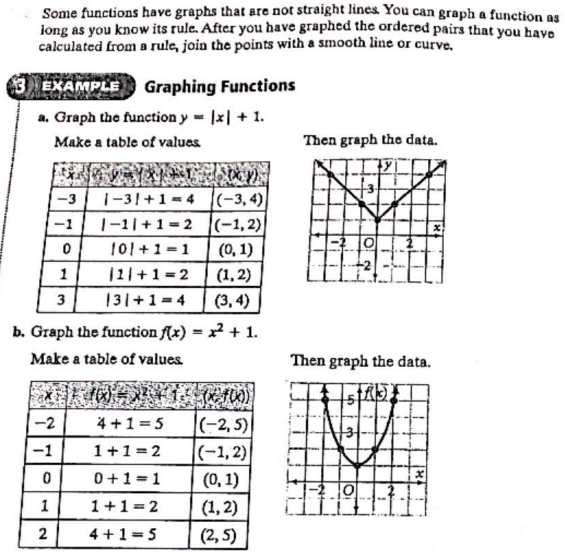
The inputs are values of the independent variable. The outputs are the corresponding values of the dependent variable. Graph the independent variable on the (-3,2) Use the input and output horizontal axis. values as ordered pairs to x -2 plot points. Graph the dependent (0, -1) (3, 1- 4)- variable on the Join the points with a line or vertical axis. smooth curve to give a general picture of the function. EXAMPLE Three Views of a Function Model the function rule y = 3x + 3 using a table of values and a graph. Step 1 Choose input values for x. Step 2 Plot points for the ordered pairs. Evaluate to find y. Step 3 Join the points to form a line. y=7x + 3 (x, y) -4 y = 3(-4)+3=1 (-4, 1) 0 y = 7(0) +3 =3 (0, 3) 2 y = 7(2) +3=4 (2, 4) O 2& Check Understanding @) Model the rule f{x) = 3x + 4 with a table of values and a graph. When you draw a graph for a real-world situation, choose appropriate intervals for the units on the axes. Be sure the intervals are equal. Also, if the data are positive numbers, use only the first quadrant. Real-World Q*;;; Problem Solving i Recording Costs Suppose your group recorded a CD. Now you want to copy and i sell it. One company charges $250 for making a master CD and designing the art i for the cover. There is also a cost of $3 to burn each CD. The total cost P(c) i depends on the number of CDs burned. Use the function rule P(c) = 250 + 3 ! tomake a table of values and a graph. : Pl =250+ 3c ' m [ parately The soundsare | | 300 | 250 +3(300) = 1150 [ (300,1150) | mixed later to achieve the desired effect. o Real-World 3 Connection Careers Recording engineers Recording Costs (dollars) 0 200 400 600* Number of CDs Check Understanding 2 a. Another company charges $300 for making a master and designing the art. It charges $2.50 for burning each CD. Use the function rule P(c) = 300 + 2.5c. Make a table of values and a graph. b. Critical Thinking Compare your graph from part (a) to the graph in Example 2. For what number of CDs is the studio in the Example less expensive? 248 Chapter 5 Graphs and FunctionsCheck Understanding 3 Make a table of values and graph each function. a. A(x) = |x| - 1 b. y = x - 1 EXERCISES For more practice, see Extra Practice. Practice and Problem Solving A Practice by Example Match each graph with its rule. Example 1 (1; f(x) = 2x 2. f(x) = 5x 3. (x) = x + 2 (page 248) A. Model each rule with a table of values and a graph. 4. f(x) = -3x 5. f(x) = -3x + 1 6. A(x) = -3x - 2 7. y = 2x - 7 8. f(x) = 8 - x 9. y = 5 + 4x 10. f(x) = 1x 11. y = 4x 12. y = x + 4 Lesson 5-3 Function Rules, Tables, and Graphs 249Example 2 13. Earnings Juan charges $3.50 per hour for baby-sitting. (page 248) a. Write a rule to describe how the amount of money M earned is a function of the number of hours h spent baby-sitting. b. Make a table of values. .c. Graph the values and join the points with a line. d. Estimation Use the graph to estimate how long it will take Juan to earn $30. 14 Geometry The figure at the right is a regular pentagon. The function P(e) = 56 describes the perimeter of a regular pentagon with side length e. Regular a. Make a table of values for e = 1,2,3, and 4. pentagon b. Graph the function. Example 3 Graph each function. (page 249) 15. y = |x| 16. y = |x| +2 17. y = x2 18. f(x) = x2 - 1 19. f(x) = 1x1 + 3 20. y = x2 + 3 21. y = [x| - 4 22. A(x) = -x2 - 1 23. f(x) = -x2 + 2B Apply Your Skills 24. a. Make a table for the perimeters of the rectangles formed by Fig. 2 each set of blue tiles. b. The perimeter P(t) is a function of the number of tiles t. Write a rule for the data in your table and graph the function. 25. Writing Describe the steps you would use to graph the function rule A(x) = 3x - 2. Graph each function. 26. A(x) = 3x + 7 27. y = x2 - 4x + 4 28. y = 12x| 29. y = x + 30. f(x) = 7 - 5x 31. f(x) = 2x 32. f(x) = 2x + 1 33. y = 1 - x2 34. f(x) = -5x2 35. y = 2x - 3 36. y = 3x 37. f(x) = -|x+2138) Conserving Water The equation w = 6m models the amount of water w used by a standard shower head for a shower that takes m minutes. The function w = 3m models the water-saving shower head. a. Suppose you take a 6-minute shower using a water-saving How Long Does shower head. How much water do you save compared to an Your Shower Last?. average shower with a standard shower head? . average shower: . 12.2 min . recommended b. Graph both functions on the same coordinate plane. shower: 6 min c. Open-Ended How much water did you use during your last shower? d. How did you find your answer? 39. a. Language Arts Copy and complete the analogy: * standard head . water-saving uses 6 gal/min head cuts "Input value is to output value as independent variable water flow is to ? ." in half b. Write an analogy using input, output, domain, and range. SOURCE: Opinion Research Corp. 250 Chapter 5 Graphs and FunctionsYA 20 0 1 2 3 4 5 6 7 8 9 10 11 12 13 14 15 16 17 18 19 20 X 0 1 2 3 4 5 6 7 8 9 10 11 12 13 14 15 16 17 18 19 20 XYA 20 0 1 2 3 4 5 6 7 8 9 10 11 12 13 14 15 16 17 18 19 20 X 0 1 2 3 4 5 6 7 8 9 10 11 12 13 14 15 16 17 18 19 20 XYA 20 0 1 2 3 4 5 6 7 8 9 10 11 12 13 14 15 16 17 18 19 20 X 0 1 2 3 4 5 6 7 8 9 10 11 12 13 14 15 16 17 18 19 20 XYA 20 0 1 2 3 4 5 6 7 8 9 10 11 12 13 14 15 16 17 18 19 20 X 0 1 2 3 4 5 6 7 8 9 10 11 12 13 14 15 16 17 18 19 20 XSome functions have graphs that are not straight lines. You can graph a function as long as you know its rule. After you have graphed the ordered pairs that you have calculated from a rule, join the points with a smooth line or curve. EXAMPLE Graphing Functions a. Graph the function y = (x | + 1. Make a table of values Then graph the data. -3 1-3/+1-4 (-3, 4 ) -1 1-1/+1 =2 (-1, 2) 10|+1 =1 (0, 1) 1 11/+1 =2 (1, 2) 13/+1 =4 (3, 4) b. Graph the function f(x) = x2 + 1. Make a table of values. Then graph the data. -2 4+1 =5 (-2,5) 3 -1 1+1 =2 (-1, 2) 0 0+1 =1 (0, 1) X 1+1=2 (1, 2) 2 4+1 =5 (2, 5)
Step by Step Solution
There are 3 Steps involved in it
Step: 1
Get Instant Access to Expert-Tailored Solutions
See step-by-step solutions with expert insights and AI powered tools for academic success
Step: 2
Step: 3
Ace Your Homework with AI
Get the answers you need in no time with our AI-driven, step-by-step assistance