Question
Gross state product (GSP) of 50 states are measured in 13 different areas of economic activity list below. In order to remove the influence of
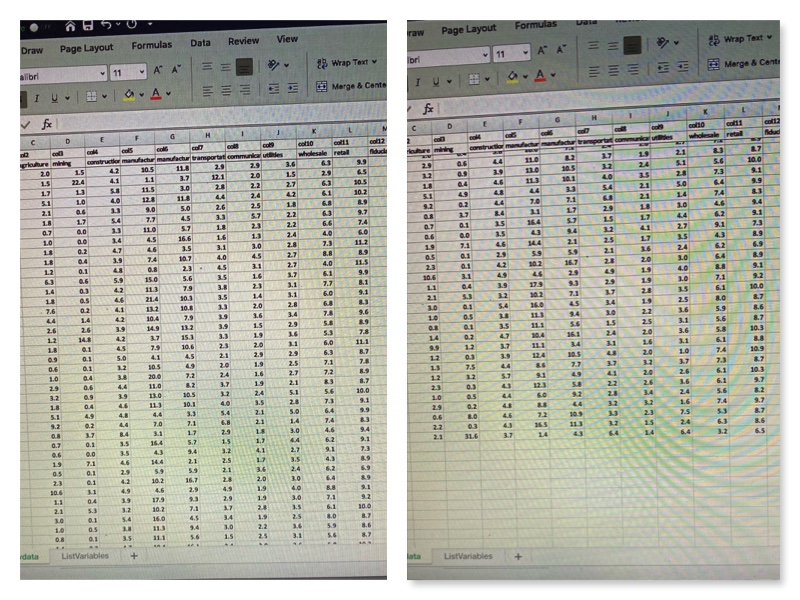
Gross state product (GSP) of 50 states are measured in 13 different areas of economic activity list below. In order to remove the influence of scale, the contribution of each area is measured as the proportion of the total GSP. The data can be found in file gsp.sav. Columns 2-14 in the data are the shares of GSP of the following areas:
agriculture
mining
construction
manufacturing (durable goods)
manufacturing (nondurable goods)
transportation
communications
utilities
wholesale
retail
fiduciary, insurance, and real estate
services
government
Conduct a principal component analysis of the data set.
a.Check if the correlation in the data supports PCA.
b.Extract the factors using PCA, use a scree plot to help determine the appropriate number of factors.
c.Evaluate the goodness of the factor model using the proportion of variance explained and the communalities.
d.Comment on the unrotated component loadings.
e.Perform Varimax factor rotation, comment on the loading structure.

Step by Step Solution
There are 3 Steps involved in it
Step: 1

Get Instant Access to Expert-Tailored Solutions
See step-by-step solutions with expert insights and AI powered tools for academic success
Step: 2

Step: 3

Ace Your Homework with AI
Get the answers you need in no time with our AI-driven, step-by-step assistance
Get Started


