Question
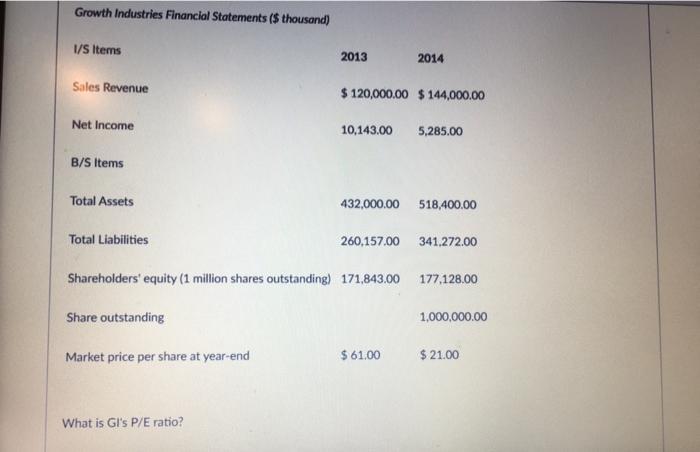
Growth Industries Financial Statements ($ thousand) I/S Items Sales Revenue Net Income B/S Items Total Assets Total Liabilities 2013 2014 $ 120,000.00 $144,000.00 10,143.00

Growth Industries Financial Statements ($ thousand) I/S Items Sales Revenue Net Income B/S Items Total Assets Total Liabilities 2013 2014 $ 120,000.00 $144,000.00 10,143.00 5,285.00 432,000.00 518,400.00 260,157.00 341,272.00 Shareholders' equity (1 million shares outstanding) 171,843.00 177,128.00 Share outstanding 1,000,000.00 Market price per share at year-end $61.00 $21.00 What is Gl's P/E ratio?
Step by Step Solution
There are 3 Steps involved in it
Step: 1

Get Instant Access to Expert-Tailored Solutions
See step-by-step solutions with expert insights and AI powered tools for academic success
Step: 2

Step: 3

Ace Your Homework with AI
Get the answers you need in no time with our AI-driven, step-by-step assistance
Get StartedRecommended Textbook for
Understanding Financial Accounting
Authors: Christopher Burnley, Robert Hoskin, Maureen Fizzell, Donald
1st Canadian Edition
1118849388, 9781119048572, 978-1118849385
Students also viewed these Finance questions
Question
Answered: 1 week ago
Question
Answered: 1 week ago
Question
Answered: 1 week ago
Question
Answered: 1 week ago
Question
Answered: 1 week ago
Question
Answered: 1 week ago
Question
Answered: 1 week ago
Question
Answered: 1 week ago
Question
Answered: 1 week ago
Question
Answered: 1 week ago
Question
Answered: 1 week ago
Question
Answered: 1 week ago
Question
Answered: 1 week ago
Question
Answered: 1 week ago
Question
Answered: 1 week ago
Question
Answered: 1 week ago
Question
Answered: 1 week ago
Question
Answered: 1 week ago
Question
Answered: 1 week ago
Question
Answered: 1 week ago
Question
Answered: 1 week ago
Question
Answered: 1 week ago
Question
Answered: 1 week ago
Question
Answered: 1 week ago
View Answer in SolutionInn App


