

Answered step by step
Verified Expert Solution
Question
1 Approved Answer
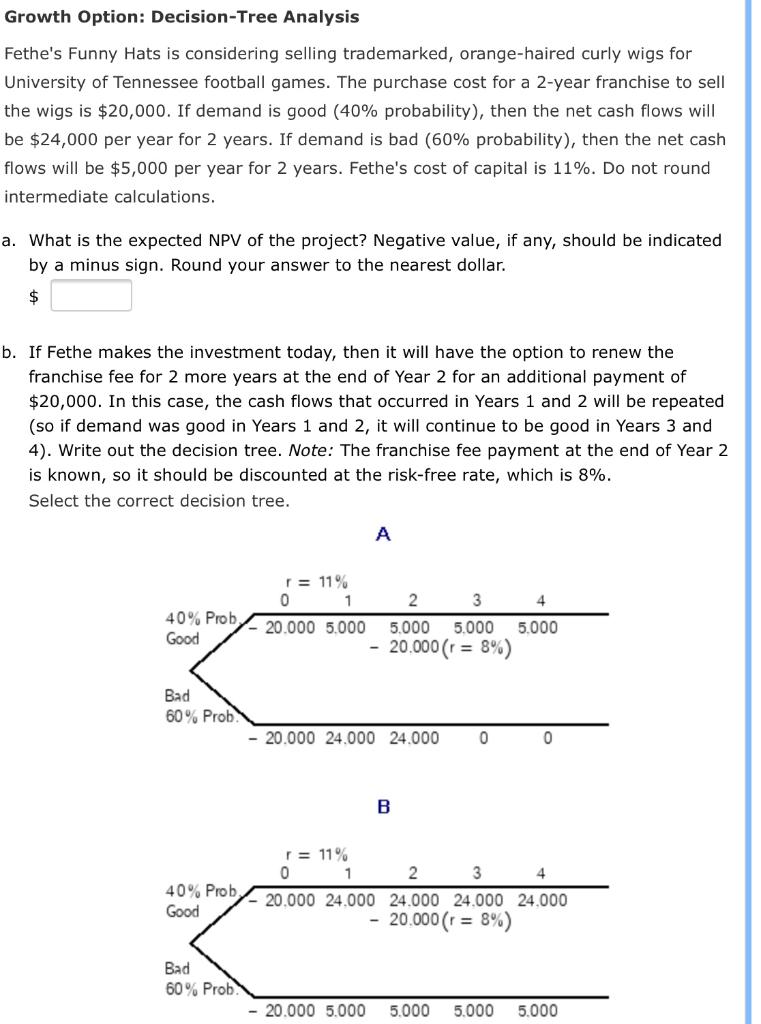
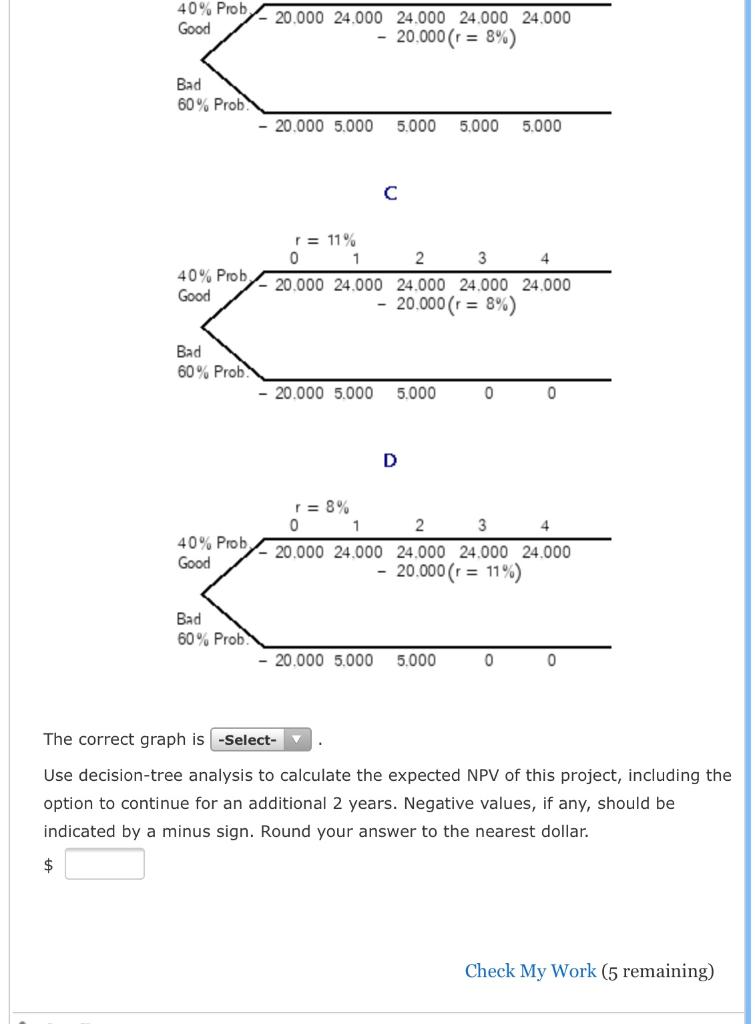
Growth Option: Decision-Tree Analysis Fethe's Funny Hats is considering selling trademarked, orange-haired curly wigs for University of Tennessee football games. The purchase cost for a
Step by Step Solution
There are 3 Steps involved in it
Step: 1

Get Instant Access to Expert-Tailored Solutions
See step-by-step solutions with expert insights and AI powered tools for academic success
Step: 2

Step: 3
Ace Your Homework with AI
Get the answers you need in no time with our AI-driven, step-by-step assistance
Get Started
International Financial Operations Arbitrage Hedging Speculation Financing And Investment
Authors: I. Moosa
1st Edition
1349433128, 978-1349433124