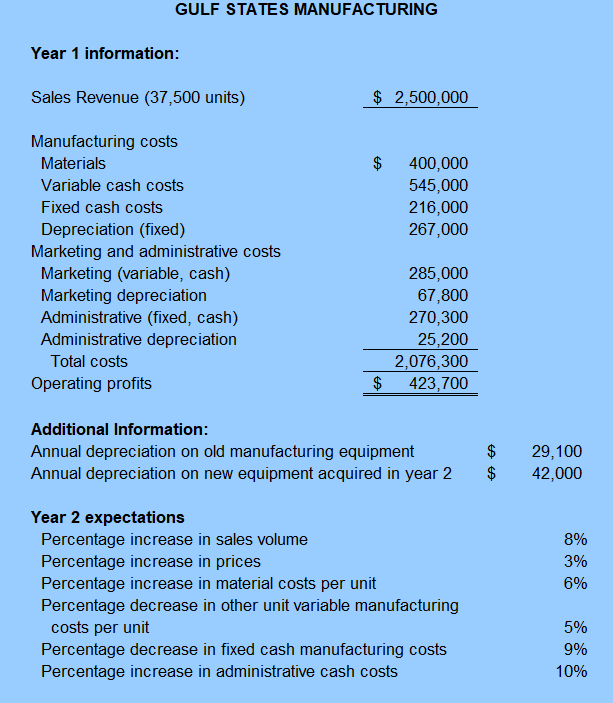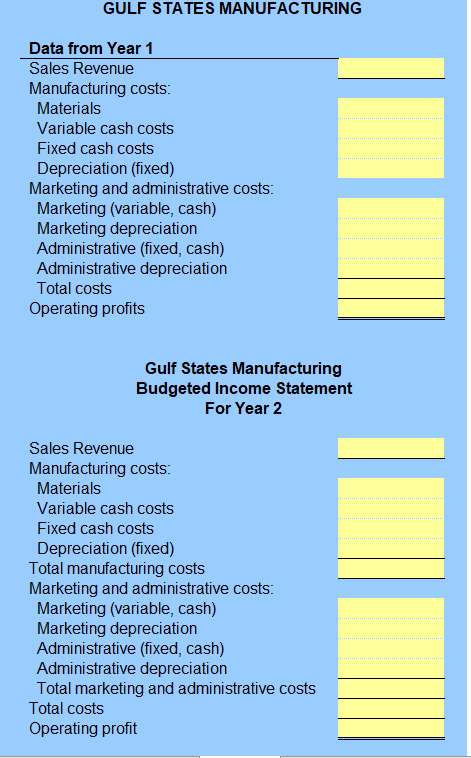

GULF STATES MANUFACTURING Year 1 information Sales Revenue (37,500 units) $ 2,500,000 Manufacturing costs Materials Variable cash costs Fixed cash costs Depreciation (fixed) $400,000 545,000 216,000 267,000 Marketing and administrative costs Marketing (variable, cash) Marketing depreciation Administrative (fixed, cash) Administrative depreciation 285,000 67,800 270,300 25,200 2,076,300 $ 423,700 Total costs Operating profits Additional Tnformation: Annual depreciation on old manufacturing equipment Annual depreciation on new equipment acquired in year 2 $ 29,100 $42,000 Year 2 expectations Percentage increase in sales volume Percentage increase in prices Percentage increase in material costs per unit Percentage decrease in other unit variable manufacturing 5% 3% 5% costs per unit Percentage decrease in fixed cash manufacturing costs Percentage increase in administrative cash costs 5% 9% 10% GULF STATES MANUFACTURING Data from Year 1 Sales Revenue Manufacturing costs Materials Variable cash costs Fixed cash costs Depreciation (fixed) Marketing and administrative costs Marketing (variable, cash) Marketing depreciation Administrative (fixed, cash) Administrative depreciation Total costs Operating profits Gulf States Manufacturing Budgeted Income Statement For Year 2 Sales Revenue Manufacturing costs Materials Variable cash costs Fixed cash costs Depreciation (fixed) Total manufacturing costs Marketing and administrative costs Marketing (variable, cash) Marketing depreciation Administrative (fixed, cash) Administrative depreciation Total marketing and administrative costs Total costs Operating profit GULF STATES MANUFACTURING Year 1 information Sales Revenue (37,500 units) $ 2,500,000 Manufacturing costs Materials Variable cash costs Fixed cash costs Depreciation (fixed) $400,000 545,000 216,000 267,000 Marketing and administrative costs Marketing (variable, cash) Marketing depreciation Administrative (fixed, cash) Administrative depreciation 285,000 67,800 270,300 25,200 2,076,300 $ 423,700 Total costs Operating profits Additional Tnformation: Annual depreciation on old manufacturing equipment Annual depreciation on new equipment acquired in year 2 $ 29,100 $42,000 Year 2 expectations Percentage increase in sales volume Percentage increase in prices Percentage increase in material costs per unit Percentage decrease in other unit variable manufacturing 5% 3% 5% costs per unit Percentage decrease in fixed cash manufacturing costs Percentage increase in administrative cash costs 5% 9% 10% GULF STATES MANUFACTURING Data from Year 1 Sales Revenue Manufacturing costs Materials Variable cash costs Fixed cash costs Depreciation (fixed) Marketing and administrative costs Marketing (variable, cash) Marketing depreciation Administrative (fixed, cash) Administrative depreciation Total costs Operating profits Gulf States Manufacturing Budgeted Income Statement For Year 2 Sales Revenue Manufacturing costs Materials Variable cash costs Fixed cash costs Depreciation (fixed) Total manufacturing costs Marketing and administrative costs Marketing (variable, cash) Marketing depreciation Administrative (fixed, cash) Administrative depreciation Total marketing and administrative costs Total costs Operating profit


