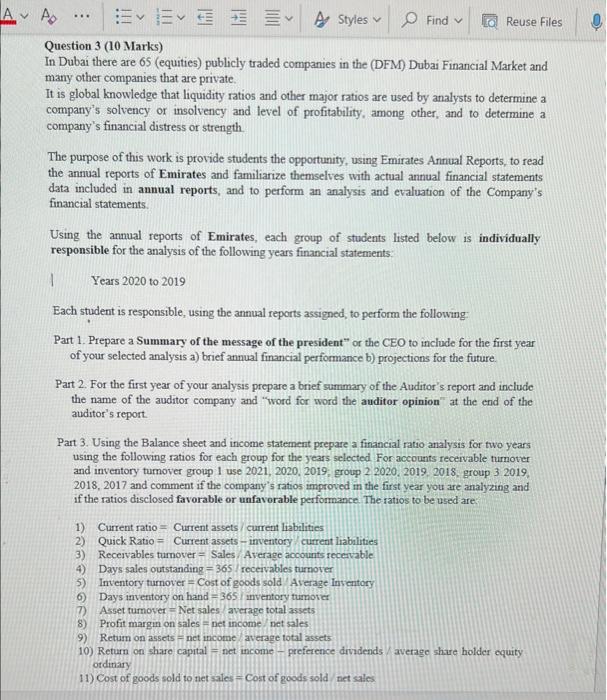
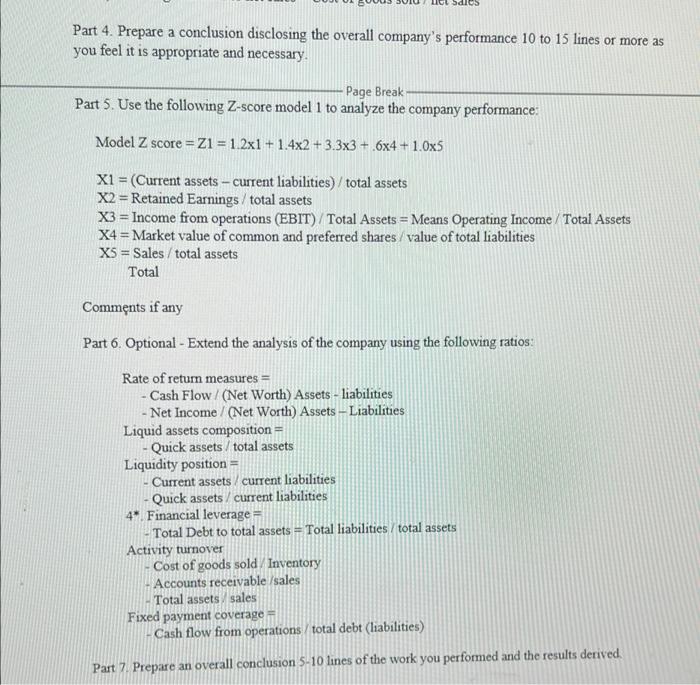
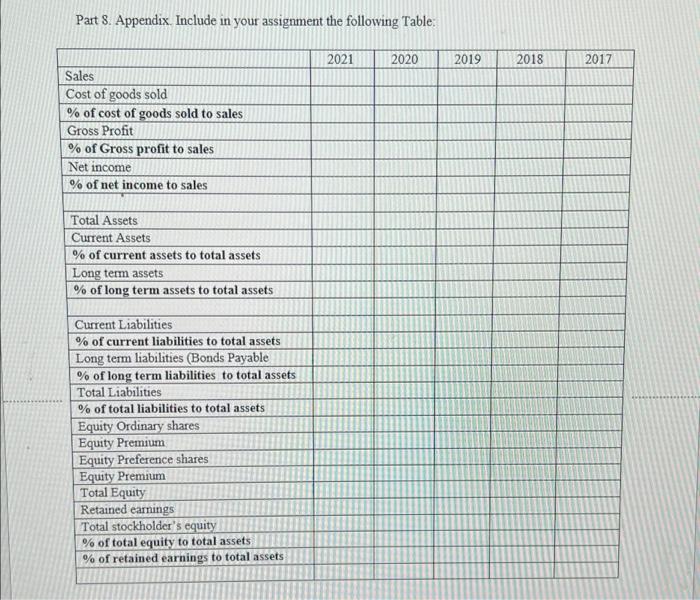
H. AD EE A Styles Find Reuse Files Question 3 (10 Marks) In Dubai there are 65 (equities) publicly traded companies in the (DFM) Dubai Financial Market and many other companies that are private. It is global knowledge that liquidity ratios and other major ratios are used by analysts to determine a company's solvency or insolvency and level of profitability, among other, and to determine a company's financial distress or strength The purpose of this work is provide students the opportunity, using Emirates Annual Reports, to read the annual reports of Emirates and familiarize themselves with actual annual financial statements data included in annual reports, and to perform an analysis and evaluation of the Company's financial statements Using the annual reports of Emirates, each group of students listed below is individually responsible for the analysis of the following years financial statements 1 Years 2020 to 2019 Each student is responsible, using the annual reports assigned to perform the following: Part 1. Prepare a Summary of the message of the president of the CEO to include for the first year of your selected analysis a) brief annual financial performance b) projections for the future. Part 2. For the first year of your analysis prepare a brief summary of the Auditor's report and include the name of the auditor company and word for word the auditor opinion at the end of the auditor's report Part 3. Using the Balance sheet and income statement prepare a financial ratio analysis for two years using the following ratios for each group for the years selected For accounts receivable turnover and inventory tumover group I use 2021, 2020. 2019. group 2 2020, 2019 2018 group 3 2019, 2018, 2017 and comment if the company's ratios improved in the first year you are analyzing and if the ratios disclosed favorable or unfavorable performance. The ratios to be used are. 1). Current ratio = Current assets current liabilities 2) Quick Ratio = Current assets - inventory current liabilities 3) Receivables turnover = Sales Average accounts receivable 4) Days sales outstanding = 365 receivables turnover 5) Inventory turnover = Cost of goods sold Average Inventory 6) Days inventory on hand = 365 / ventory tumorer 7) Asset tumover = Net sales average total assets 8) Profit margin on sales = net income net sales 9) Return on assets = net income average total assets 10) Return on share capital - net income - preference dividends average share holder equity ordinary 11) Cost of goods sold to net sales = Cost of goods sold net sales Part 4. Prepare a conclusion disclosing the overall company's performance 10 to 15 lines or more as you feel it is appropriate and necessary. - Page Break Part 5. Use the following Z-score model 1 to analyze the company performance: Model Z score = Z1 = 1.2x1 + 1.4x2 +3.3x3 + 6x4 +1.0x5 -- X1 = (Current assets - current liabilities) /total assets X2 = Retained Earnings / total assets X3 = Income from operations (EBIT) Total Assets = Means Operating Income Total Assets X4 = Market value of common and preferred shares / value of total liabilities XS = Sales / total assets Total Comments if any Part 6. Optional - Extend the analysis of the company using the following ratios: Rate of retum measures = - Cash Flow / (Net Worth) Assets - liabilities - Net Income / (Net Worth) Assets - Liabilities Liquid assets composition = - Quick assets/total assets Liquidity position = - Current assets/ current liabilities Quick assets/ current liabilities 4* Financial leverage Total Debt to total assets = Total liabilities / total assets Activity turnover Cost of goods sold Inventory Accounts receivable sales Total assets sales Fixed payment coverage Cash flow from operations total debt (liabilities) Part 7. Prepare an overall conclusion 5-10 lines of the work you performed and the results derived Part 8. Appendix. Include in your assignment the following Table: 2021 2020 2019 2018 2017 Sales Cost of goods sold % of cost of goods sold to sales Gross Profit % of Gross profit to sales Net income % of net income to sales Total Assets Current Assets % of current assets to total assets Long term assets % of long term assets to total assets Current Liabilities % of current liabilities to total assets Long term liabilities (Bonds Payable % of long term liabilities to total assets Total Liabilities % of total liabilities to total assets Equity Ordinary shares Equity Premium Equity Preference shares Equity Premium Total Equity Retained earnings Total stockholder's equity % of total equity to total assets % of retained earnings to total assets H. AD EE A Styles Find Reuse Files Question 3 (10 Marks) In Dubai there are 65 (equities) publicly traded companies in the (DFM) Dubai Financial Market and many other companies that are private. It is global knowledge that liquidity ratios and other major ratios are used by analysts to determine a company's solvency or insolvency and level of profitability, among other, and to determine a company's financial distress or strength The purpose of this work is provide students the opportunity, using Emirates Annual Reports, to read the annual reports of Emirates and familiarize themselves with actual annual financial statements data included in annual reports, and to perform an analysis and evaluation of the Company's financial statements Using the annual reports of Emirates, each group of students listed below is individually responsible for the analysis of the following years financial statements 1 Years 2020 to 2019 Each student is responsible, using the annual reports assigned to perform the following: Part 1. Prepare a Summary of the message of the president of the CEO to include for the first year of your selected analysis a) brief annual financial performance b) projections for the future. Part 2. For the first year of your analysis prepare a brief summary of the Auditor's report and include the name of the auditor company and word for word the auditor opinion at the end of the auditor's report Part 3. Using the Balance sheet and income statement prepare a financial ratio analysis for two years using the following ratios for each group for the years selected For accounts receivable turnover and inventory tumover group I use 2021, 2020. 2019. group 2 2020, 2019 2018 group 3 2019, 2018, 2017 and comment if the company's ratios improved in the first year you are analyzing and if the ratios disclosed favorable or unfavorable performance. The ratios to be used are. 1). Current ratio = Current assets current liabilities 2) Quick Ratio = Current assets - inventory current liabilities 3) Receivables turnover = Sales Average accounts receivable 4) Days sales outstanding = 365 receivables turnover 5) Inventory turnover = Cost of goods sold Average Inventory 6) Days inventory on hand = 365 / ventory tumorer 7) Asset tumover = Net sales average total assets 8) Profit margin on sales = net income net sales 9) Return on assets = net income average total assets 10) Return on share capital - net income - preference dividends average share holder equity ordinary 11) Cost of goods sold to net sales = Cost of goods sold net sales Part 4. Prepare a conclusion disclosing the overall company's performance 10 to 15 lines or more as you feel it is appropriate and necessary. - Page Break Part 5. Use the following Z-score model 1 to analyze the company performance: Model Z score = Z1 = 1.2x1 + 1.4x2 +3.3x3 + 6x4 +1.0x5 -- X1 = (Current assets - current liabilities) /total assets X2 = Retained Earnings / total assets X3 = Income from operations (EBIT) Total Assets = Means Operating Income Total Assets X4 = Market value of common and preferred shares / value of total liabilities XS = Sales / total assets Total Comments if any Part 6. Optional - Extend the analysis of the company using the following ratios: Rate of retum measures = - Cash Flow / (Net Worth) Assets - liabilities - Net Income / (Net Worth) Assets - Liabilities Liquid assets composition = - Quick assets/total assets Liquidity position = - Current assets/ current liabilities Quick assets/ current liabilities 4* Financial leverage Total Debt to total assets = Total liabilities / total assets Activity turnover Cost of goods sold Inventory Accounts receivable sales Total assets sales Fixed payment coverage Cash flow from operations total debt (liabilities) Part 7. Prepare an overall conclusion 5-10 lines of the work you performed and the results derived Part 8. Appendix. Include in your assignment the following Table: 2021 2020 2019 2018 2017 Sales Cost of goods sold % of cost of goods sold to sales Gross Profit % of Gross profit to sales Net income % of net income to sales Total Assets Current Assets % of current assets to total assets Long term assets % of long term assets to total assets Current Liabilities % of current liabilities to total assets Long term liabilities (Bonds Payable % of long term liabilities to total assets Total Liabilities % of total liabilities to total assets Equity Ordinary shares Equity Premium Equity Preference shares Equity Premium Total Equity Retained earnings Total stockholder's equity % of total equity to total assets % of retained earnings to total assets