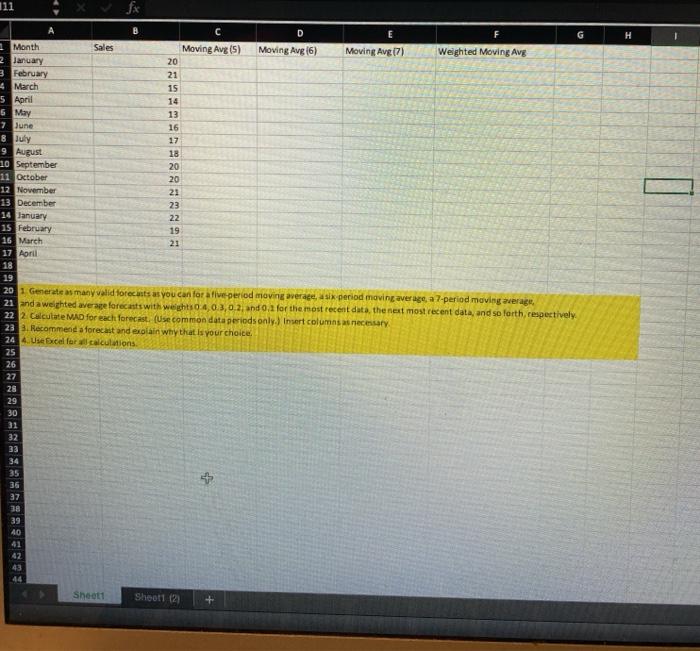
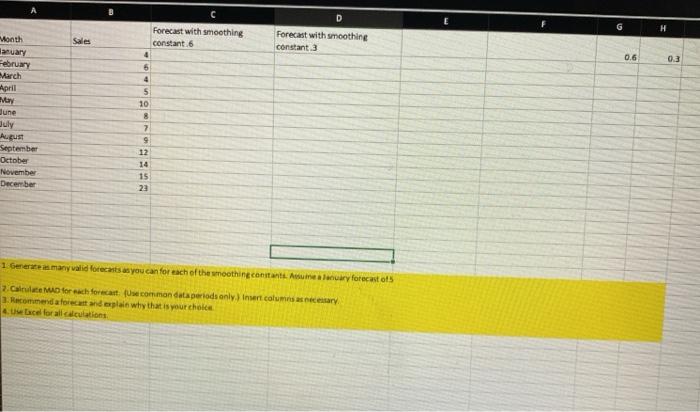
H C D G 1 Month Sales Moving Avg (5) Moving Avg 16) Moving Avg (7) Weighted Moving Avg 2 January 20 3 February 21 4 March 15 5 April 14 5 May 13 7 June 16 8 July 17 9 August 18 10 September 20 11 October 20 12 November 21 13 December 23 14 January 22 15 February 19 16 March 21 17 April 18 19 201 Generate as many valid forecasts as you can for a five period moving average, a six period moving average a 7-period moving werage, 21 and a weighted average forecasts with weights 04.0.3,0.2, and 0.1 for the most recent data, the next most recent data, and so forth, respectively 22 2 Calculate MAD for each forecast (Use common data periods only.) Insert columns as necessary 23 3. Recommend a forecast and explain why that is your choice. 24 Use cel for calculations 25 26 27 28 29 30 31 32 33 34 35 36 37 38 39 40 41 42 43 44 Sheet1 Short 2 + C D Forecast with smoothing constant 3 Sales Forecast with smoothing constant.6 4 6 Month January February March 0.6 03 4 une July August September October November December 5 10 8 7 9 12 14 15 23 1 Generate many valid forecasts as you can for each of the smoothingconstantinescary forecast ots 2. Calculated for each forecast. Use como data periods only) Insert columns necessary 1. Recommendaforecast and explain why that is your choice Lace for all calculations H C D G 1 Month Sales Moving Avg (5) Moving Avg 16) Moving Avg (7) Weighted Moving Avg 2 January 20 3 February 21 4 March 15 5 April 14 5 May 13 7 June 16 8 July 17 9 August 18 10 September 20 11 October 20 12 November 21 13 December 23 14 January 22 15 February 19 16 March 21 17 April 18 19 201 Generate as many valid forecasts as you can for a five period moving average, a six period moving average a 7-period moving werage, 21 and a weighted average forecasts with weights 04.0.3,0.2, and 0.1 for the most recent data, the next most recent data, and so forth, respectively 22 2 Calculate MAD for each forecast (Use common data periods only.) Insert columns as necessary 23 3. Recommend a forecast and explain why that is your choice. 24 Use cel for calculations 25 26 27 28 29 30 31 32 33 34 35 36 37 38 39 40 41 42 43 44 Sheet1 Short 2 + C D Forecast with smoothing constant 3 Sales Forecast with smoothing constant.6 4 6 Month January February March 0.6 03 4 une July August September October November December 5 10 8 7 9 12 14 15 23 1 Generate many valid forecasts as you can for each of the smoothingconstantinescary forecast ots 2. Calculated for each forecast. Use como data periods only) Insert columns necessary 1. Recommendaforecast and explain why that is your choice Lace for all calculations


