Answered step by step
Verified Expert Solution
Question
1 Approved Answer
h. Determine the incremental depreciation between the old and new equipment and the related tax shield benefits. (Enter the tax rate as a decimal
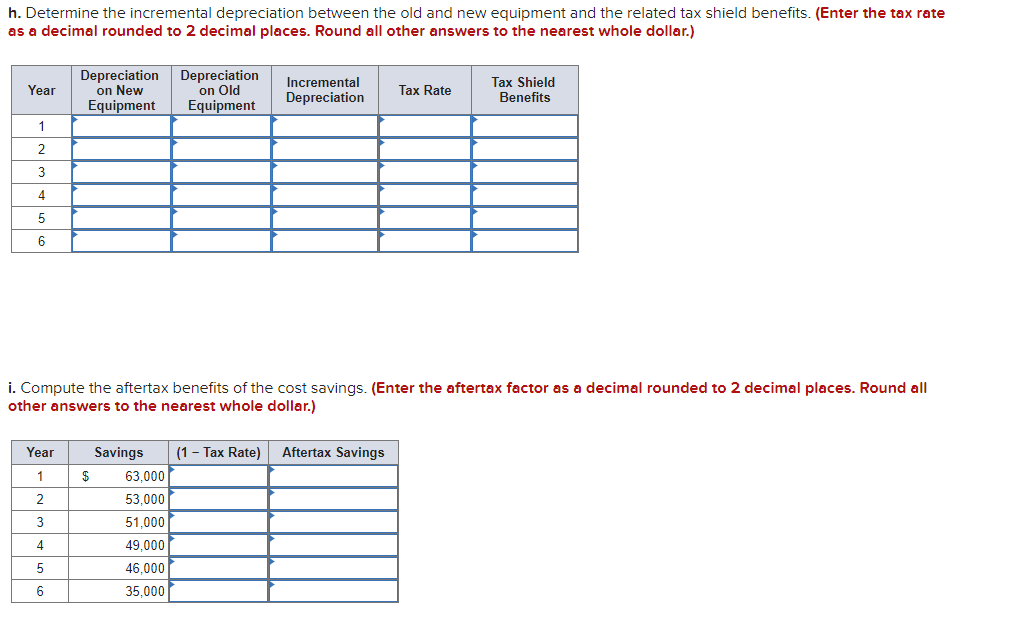
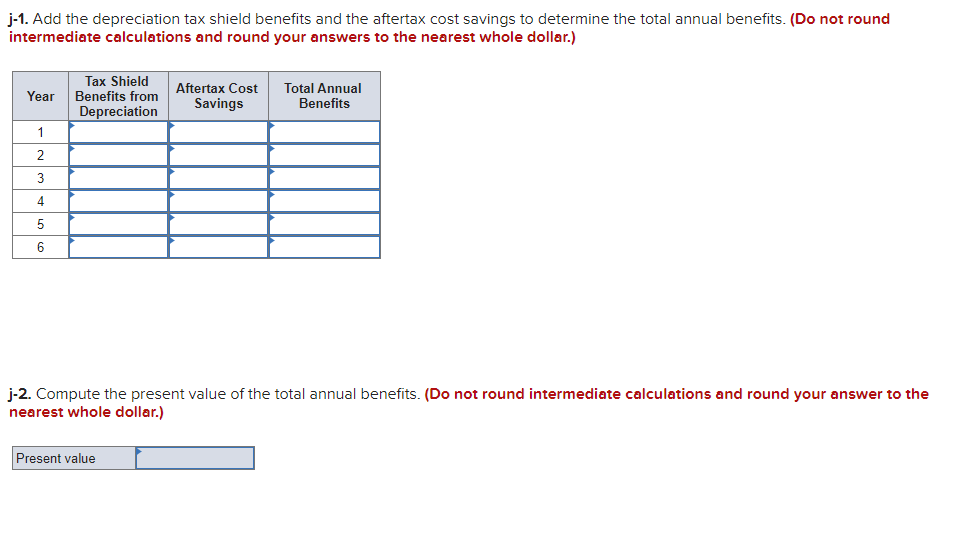
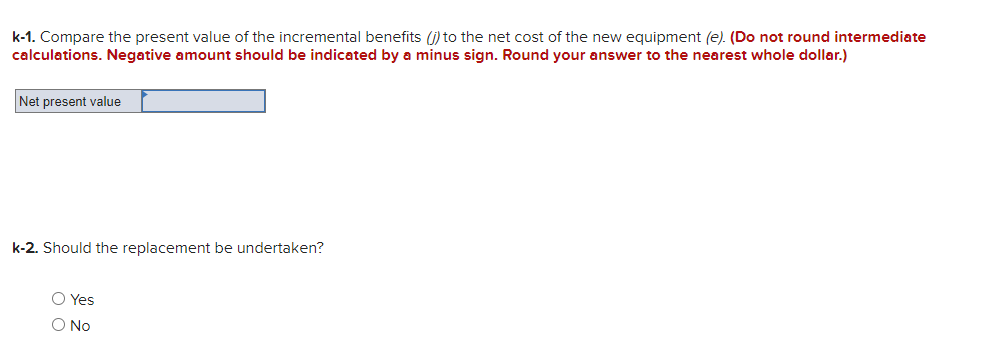
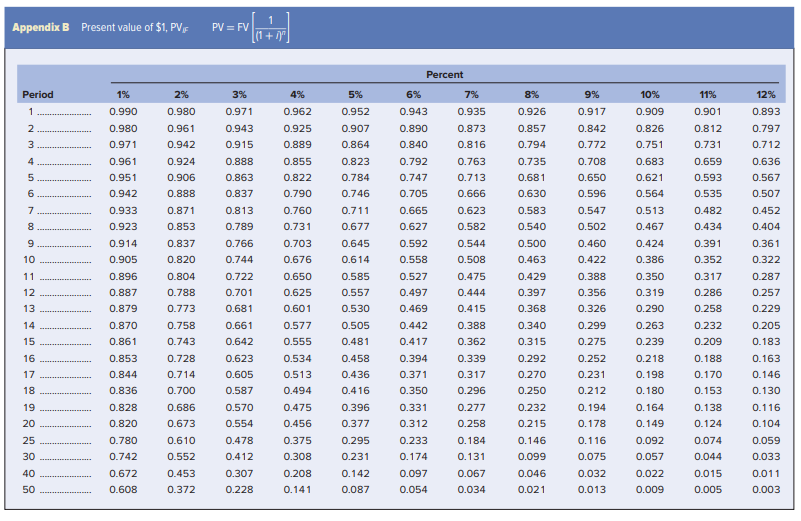
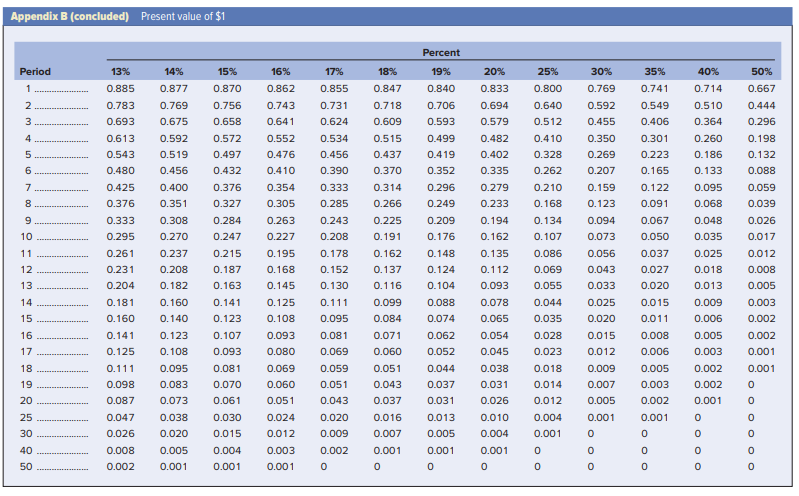
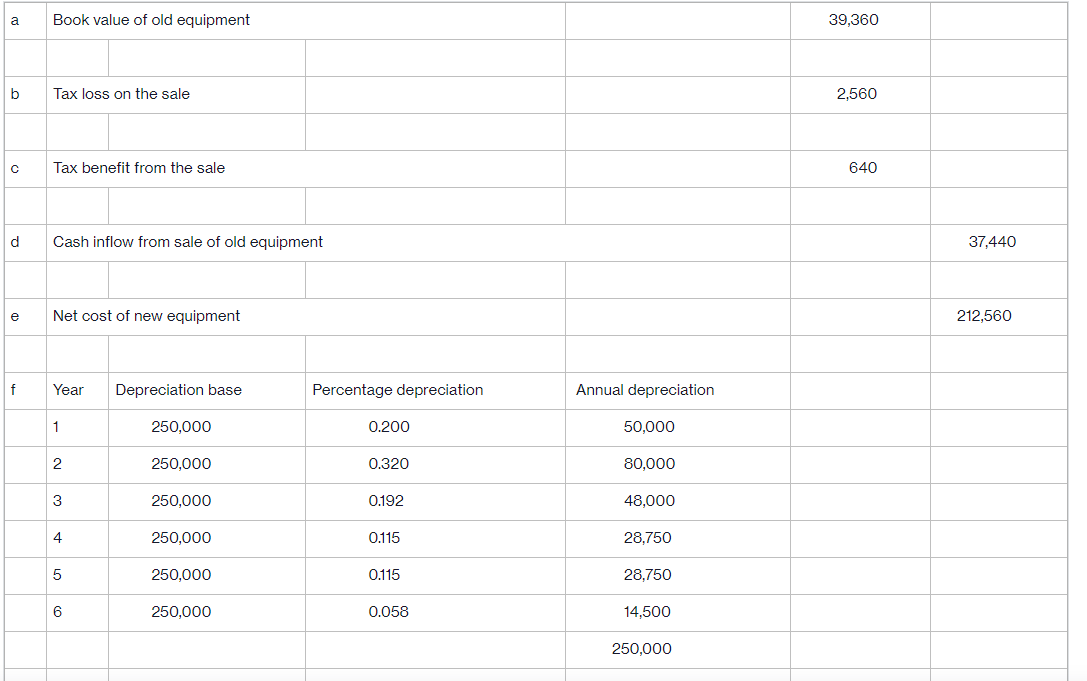

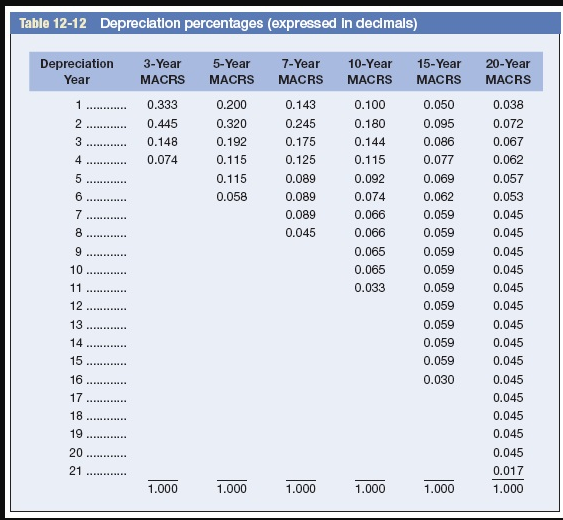
h. Determine the incremental depreciation between the old and new equipment and the related tax shield benefits. (Enter the tax rate as a decimal rounded to 2 decimal places. Round all other answers to the nearest whole dollar.) Year Depreciation on New Equipment Depreciation on Old Equipment Incremental Depreciation Tax Rate Tax Shield Benefits 1 2 3 4 5 6 i. Compute the aftertax benefits of the cost savings. (Enter the aftertax factor as a decimal rounded to 2 decimal places. Round all other answers to the nearest whole dollar.) Year Savings (1 - Tax Rate) Aftertax Savings 1 $ 63,000 2 53,000 3 51,000 4 49,000 5 46,000 6 35,000 j-1. Add the depreciation tax shield benefits and the aftertax cost savings to determine the total annual benefits. (Do not round intermediate calculations and round your answers to the nearest whole dollar.) Year Tax Shield Benefits from Depreciation Aftertax Cost Savings Total Annual Benefits 1 2 3 4 5 6 j-2. Compute the present value of the total annual benefits. (Do not round intermediate calculations and round your answer to the nearest whole dollar.) Present value k-1. Compare the present value of the incremental benefits (/) to the net cost of the new equipment (e). (Do not round intermediate calculations. Negative amount should be indicated by a minus sign. Round your answer to the nearest whole dollar.) Net present value k-2. Should the replacement be undertaken? Yes No Appendix B Present value of $1, PV, 1 PV=FV 1+ Percent Period 1% 2% 3% 4% 5% 6% 7% 8% 9% 10% 11% 12% 1 0.990 0.980 0.971 0.962 0.952 0.943 0.935 0.926 0.917 0.909 0.901 0.893 23456780 0.980 0.961 0.943 0.925 0.907 0.890 0.873 0.857 0.842 0.826 0.812 0.797 0.971 0.942 0.915 0.889 0.864 0.840 0.816 0.794 0.772 0.751 0.731 0.712 0.961 0.924 0.888 0.855 0.823 0.792 0.763 0.735 0.708 0.683 0.659 0.636 0.951 0.906 0.863 0.822 0.784 0.747 0.713 0.681 0.650 0.621 0.593 0.567 0.942 0.888 0.837 0.790 0.746 0.705 0.666 0.630 0.596 0.564 0.535 0.507 0.933 0.871 0.813 0.760 0.711 0.665 0.623 0.583 0.547 0.513 0.482 0.452 0.923 0.853 0.789 0.731 0.677 0.627 0.582 0.540 0.502 0.467 0.434 0.404 9 0.914 0.837 0.766 0.703 0.645 0.592 0.544 0.500 0.460 0.424 0.391 0.361 10 0.905 0.820 0.744 0.676 0.614 0.558 0.508 0.463 0.422 0.386 0.352 0.322 11 0.896 0.804 0.722 0.650 0.585 0.527 0.475 0.429 0.388 0.350 0.317 0.287 12 0.887 0.788 0.701 0.625 0.557 0.497 0.444 0.397 0.356 0.319 0.286 0.257 13 0.879 0.773 0.681 0.601 0.530 0.469 0.415 0.368 0.326 0.290 0.258 0.229 14 0.870 0.758 0.661 0.577 0.505 0.442 0.388 0.340 0.299 0.263 0.232 0.205 15 0.861 0.743 0.642 0.555 0.481 0.417 0.362 0.315 0.275 0.239 0.209 0.183 16 0.853 0.728 0.623 0.534 0.458 0.394 0.339 0.292 0.252 0.218 0.188 0.163 17 0.844 0.714 0.605 0.513 0.436 0.371 0.317 0.270 0.231 0.198 0.170 0.146 18 0.836 0.700 0.587 0.494 0.416 0.350 0.296 0.250 0.212 0.180 0.153 0.130 19 0.828 0.686 0.570 0.475 0.396 0.331 0.277 0.232 0.194 0.164 0.138 0.116 20 0.820 0.673 0.554 0.456 0.377 0.312 0.258 0.215 0.178 0.149 0.124 0.104 25 0.780 0.610 0.478 0.375 0.295 0.233 0.184 0.146 0.116 0.092 0.074 0.059 30 0.742 0.552 0.412 0.308 0.231 0.174 0.131 0.099 0.075 0.057 0.044 0.033 40 0.672 0.453 0.307 0.208 0.142 0.097 0.067 0.046 0.032 0.022 0.015 0.011 50 0.608 0.372 0.228 0.141 0.087 0.054 0.034 0.021 0.013 0.009 0.005 0.003 Appendix B (concluded) Present value of $1 Percent Period 13% 14% 15% 16% 17% 18% 19% 20% 25% 30% 35% 40% 50% 1 0.885 0.877 0.870 0.862 0.855 0.847 0.840 0.833 0.800 0.769 0.741 0.714 0.667 2 0.783 0.769 0.756 0.743 0.731 0.718 0.706 0.694 0.640 0.592 0.549 0.510 0.444 3 0.693 0.675 0.658 0.641 0.624 0.609 0.593 0.579 0.512 0.455 0.406 0.364 0.296 4 0.613 0.592 0.572 0.552 0.534 0.515 0.499 0.482 0.410 0.350 0.301 0.260 0.198 5 0.543 0.519 0.497 0.476 0.456 0.437 0.419 0.402 0.328 0.269 0.223 0.186 0.132 6 0.480 0.456 0.432 0.410 0.390 0.370 0.352 0.335 0.262 0.207 0.165 0.133 0.088 7 0.425 0.400 0.376 0.354 0.333 0.314 0.296 0.279 0.210 0.159 0.122 0.095 0.059 8 0.376 0.351 0.327 0.305 0.285 0.266 0.249 0.233 0.168 0.123 0.091 0.068 0.039 9 0.333 0.308 0.284 0.263 0.243 0.225 0.209 0.194 0.134 0.094 0.067 0.048 0.026 10 0.295 0.270 0.247 0.227 0.208 0.191 0.176 0.162 0.107 0.073 0.050 0.035 0.017 11 0.261 0.237 0.215 0.195 0.178 0.162 0.148 0.135 0.086 0.056 0.037 0.025 0.012 12 0.231 0.208 0.187 0.168 0.152 0.137 0.124 0.112 0.069 0.043 0.027 0.018 0.008 13 0.204 0.182 0.163 0.145 0.130 0.116 0.104 0.093 0.055 0.033 0.020 0.013 0.005 14 0.181 0.160 0.141 0.125 0.111 0.099 0.088 0.078 0.044 0.025 0.015 0.009 0.003 15 0.160 0.140 0.123 0.108 0.095 0.084 0.074 0.065 0.035 0.020 0.011 0.006 0.002 16 0.141 0.123 0.107 0.093 0.081 0.071 0.062 0.054 0.028 0.015 0.008 0.005 0.002 17 0.125 0.108 0.093 0.080 0.069 0.060 0.052 0.045 0.023 0.012 0.006 0.003 0.001 18 0.111 0.095 0.081 0.069 0.059 0.051 0.044 0.038 0.018 0.009 0.005 0.002 0.001 19 0.098 0.083 0.070 0.060 0.051 0.043 0.037 0.031 0.014 0.007 0.003 0.002 20 0.087 0.073 0.061 0.051 0.043 0.037 0.031 0.026 0.012 0.005 0.002 0.001 25 0.047 0.038 0.030 0.024 0.020 0.016 0.013 0.010 0.004 0.001 0.001 30 0.026 0.020 0.015 0.012 0.009 0.007 0.005 0.004 0.001 40 0.008 0.005 0.004 0.003 0.002 0.001 0.001 0.001 0 50 0.002 0.001 0.001 0.001 0 0 0 0 00 000 oooo oooooo 0 0 a Book value of old equipment 39,360 b Tax loss on the sale Tax benefit from the sale d Cash inflow from sale of old equipment e Net cost of new equipment f Year Depreciation base Percentage depreciation Annual depreciation 1 250,000 0.200 50,000 2 250,000 0.320 80,000 3 250,000 0.192 48,000 4 250,000 0.115 28,750 5 250,000 0.115 28,750 6 250,000 0.058 14,500 250,000 2,560 640 37,440 212,560 g Year Depreciation base Percentage depreciation Annual depreciation 1 82,000 0.192 15,744 2 82,000 0.115 9,430 3 82,000 0.115 9,430 4 82,000 0.058 4,756 Table 12-12 Depreciation percentages (expressed in decimals) Depreciation 3-Year 5-Year Year MACRS MACRS 7-Year 10-Year MACRS MACRS 15-Year 20-Year MACRS MACRS 1 0.333 0.200 0.143 0.100 0.050 0.038 234 569 0.445 0.320 0.245 0.180 0.095 0.072 0.148 0.192 0.175 0.144 0.086 0.067 0.074 0.115 0.125 0.115 0.077 0.062 0.115 0.089 0.092 0.069 0.057 0.058 0.089 0.074 0.062 0.053 0.089 0.066 0.059 0.045 8 0.045 0.066 0.059 0.045 9 10 0.065 0.059 0.045 0.065 0.059 0.045 21 3456722 11 12 13 14 15 0.033 0.059 0.045 0.059 0.045 0.059 0.045 0.059 0.045 0.059 0.045 16 0.030 0.045 17 18 19 0.045 0.045 0.045 20 0.045 0.017 1.000 1.000 1.000 1.000 1.000 1.000
Step by Step Solution
There are 3 Steps involved in it
Step: 1

Get Instant Access to Expert-Tailored Solutions
See step-by-step solutions with expert insights and AI powered tools for academic success
Step: 2

Step: 3

Ace Your Homework with AI
Get the answers you need in no time with our AI-driven, step-by-step assistance
Get Started


