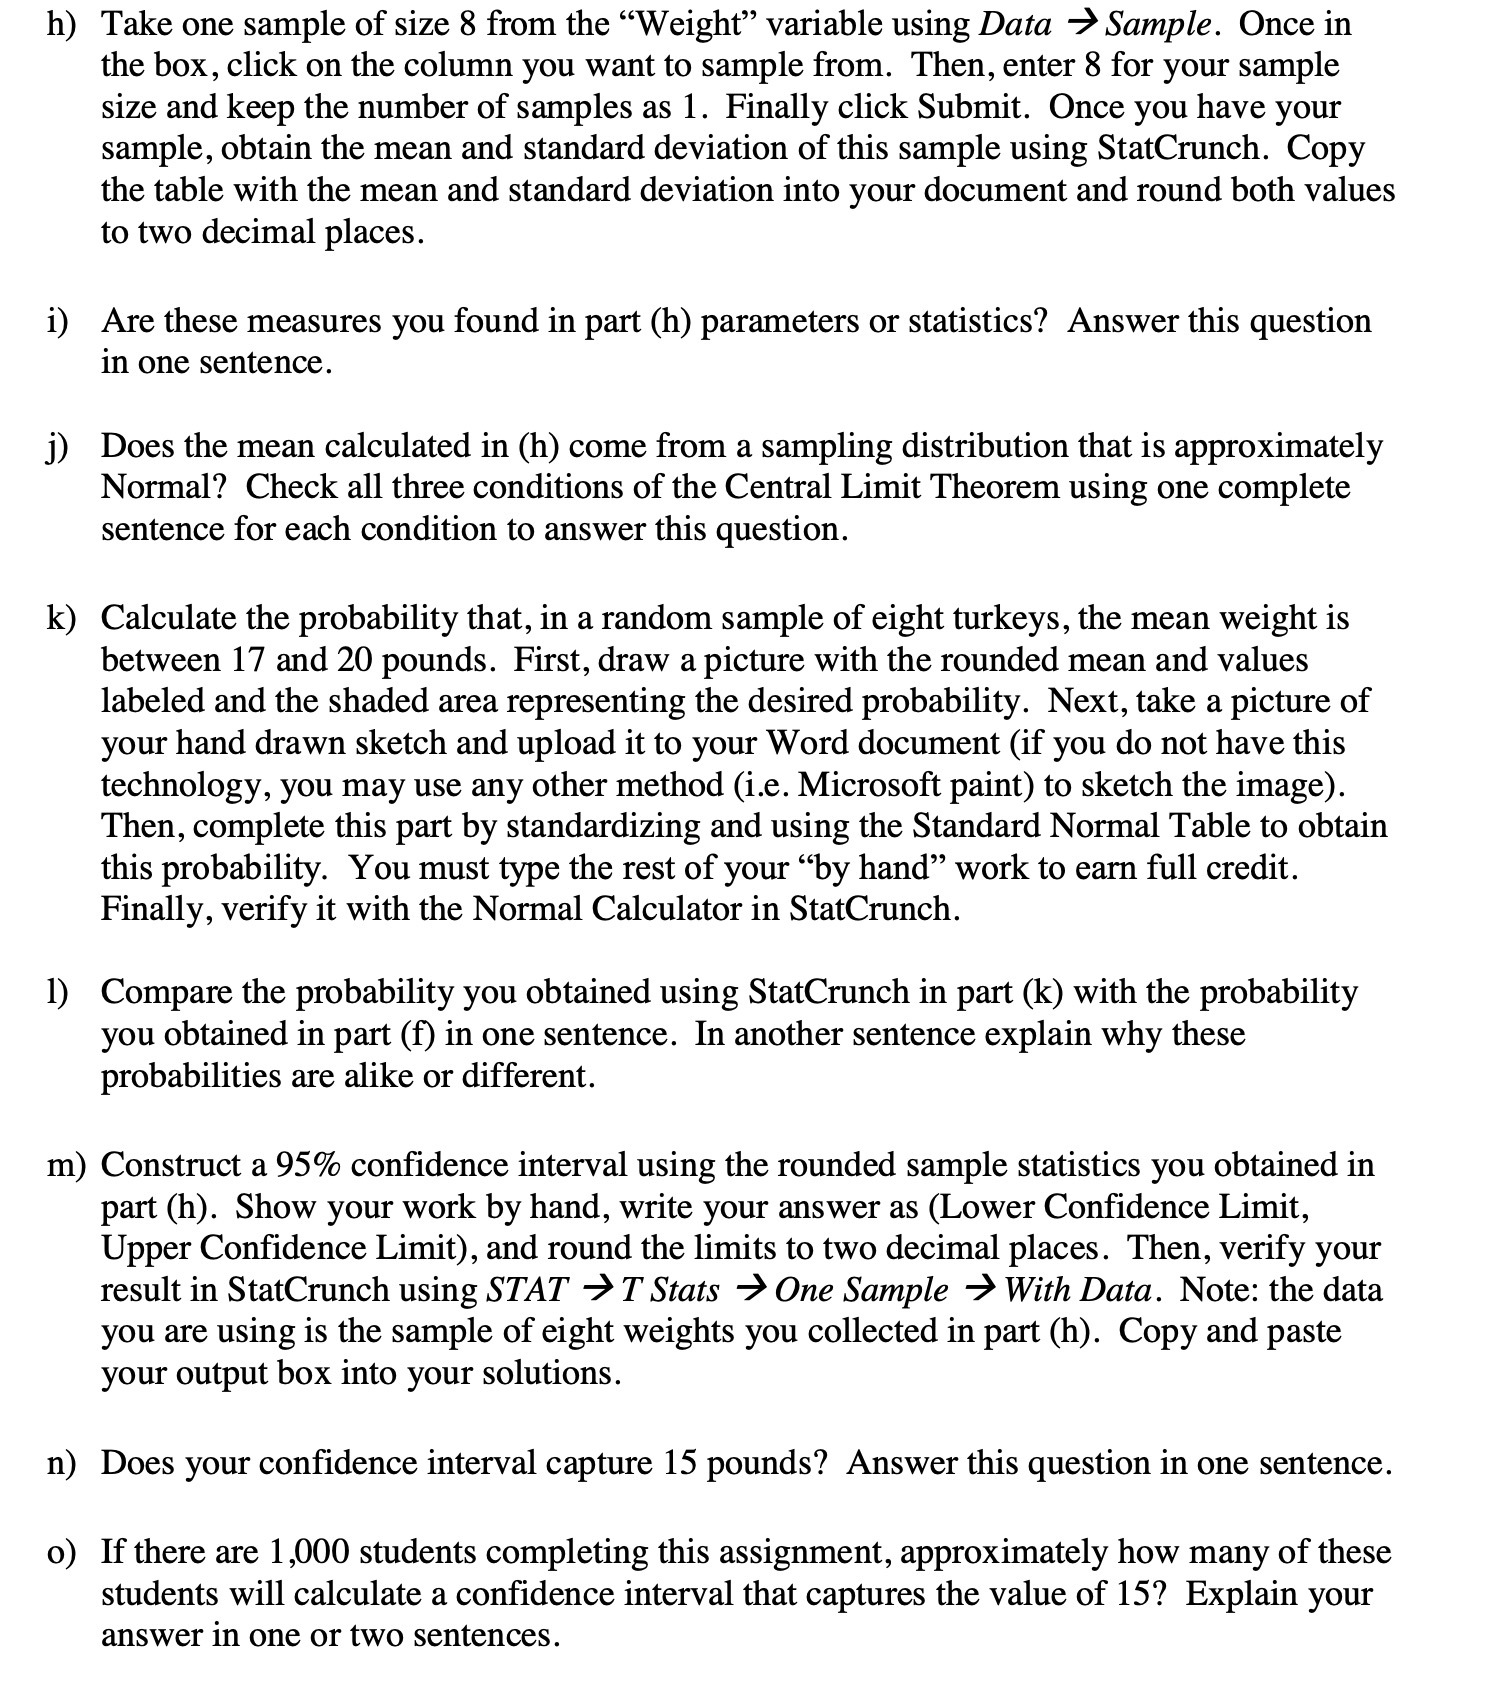
h) j) k) 1) Take one sample of size 8 from the \"Weight\" variable using Data 9 Sample. Once in the box, click on the column you want to sample from. Then, enter 8 for your sample size and keep the number of samples as 1. Finally click Submit. Once you have your sample, obtain the mean and standard deviation of this sample using StatCrunch. Copy the table with the mean and stande deviation into your document and round both values to two decimal places. Are these measures you found in part (h) parameters or statistics? Answer this question in one sentence. Does the mean calculated in (h) come from a sampling distribution that is approximately Normal? Check all three conditions of the Central Limit Theorem using one complete sentence for each condition to answer this question. Calculate the probability that, in a random sample of eight turkeys, the mean weight is between 17 and 20 pounds. First, draw a picture with the rounded mean and values labeled and the shaded area representing the desired probability. Next, take a picture of your hand drawn sketch and upload it to your Word document (if you do not have this technology, you may use any other method (i .e. Microsoft paint) to sketch the image). Then, complete this part by standardizing and using the Standard Normal Table to obtain this probability. You must type the rest of your \"by hand\" work to earn full credit. Finally, verify it with the Normal Calculator in StatCrunch. Compare the probability you obtained using StatCrunch in part (k) with the probability you obtained in part (f) in one sentence. In another sentence explain why these probabilities are alike or different. m) Construct a 95% confidence interval using the rounded sample statistics you obtained in part (h). Show your work by hand, write your answer as (Lower Confidence Limit, Upper Confidence Limit), and round the limits to two decimal places. Then, verify your result in StatCrunch using STAT 9 T Stats 9 One Sample 9 With Data. Note: the data you are using is the sample of eight weights you collected in part (h). Copy and paste your output box into your solutions. Does your confidence interval capture 15 pounds? Answer this question in one sentence. If there are 1,000 students completing this assignment, approximately how many of these students will calculate a confidence interval that captures the value of 15? Explain your answer in one or two sentences


