Answered step by step
Verified Expert Solution
Question
1 Approved Answer
Han invests $13,000 into a fund that combines stocks and bonds. The return varies from year to year. The balance at 5- year intervals


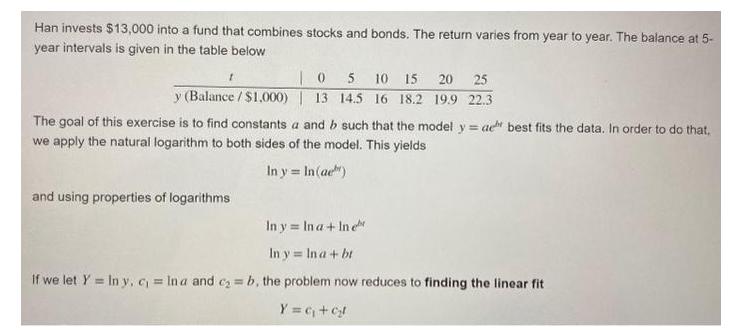
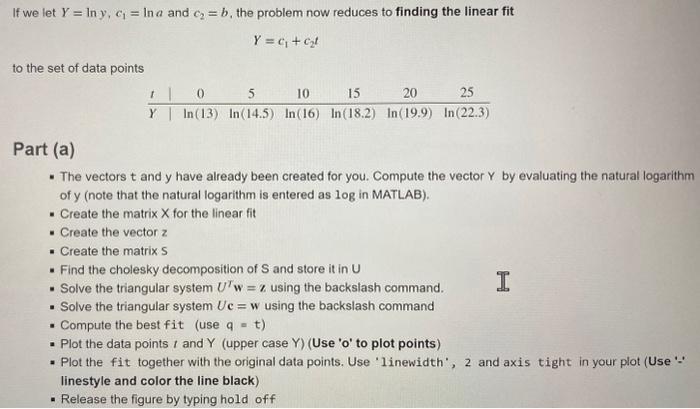
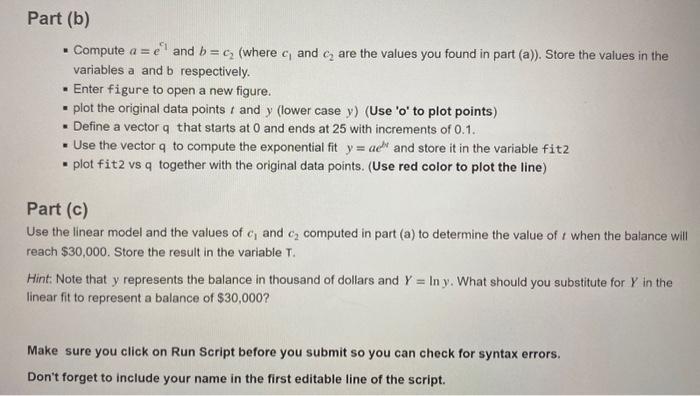
Han invests $13,000 into a fund that combines stocks and bonds. The return varies from year to year. The balance at 5- year intervals is given in the table below 0 5 10 15 20 25 y (Balance / $1,000)| 13 14.5 16 18.2 19.9 22.3 The goal of this exercise is to find constants a and b such that the model y = ae best fits the data. In order to do that. we apply the natural logarithm to both sides of the model. This yields In y = In (ae) and using properties of logarithms In y In a + In e In y = In a + bt If we let Y= In y, c, Ina and c=b, the problem now reduces to finding the linear fit Y = C+C! If we let y = In y, c = Ina and c = b, the problem now reduces to finding the linear fit Y = C + cl to the set of data points 10 5 10 15 20 25 Y In (13) In (14.5) In (16) In (18.2) In (19.9) In (22.3) Part (a) The vectors t and y have already been created for you. Compute the vector Y by evaluating the natural logarithm of y (note that the natural logarithm is entered as log in MATLAB). Create the matrix X for the linear fit Create the vector z Create the matrix s Find the cholesky decomposition of S and store it in U Solve the triangular system Uw = z using the backslash command. Solve the triangular system Uc = w using the backslash command Compute the best fit (use q = t) I Plot the data points and Y (upper case Y) (Use 'o' to plot points) Plot the fit together with the original data points. Use 'linewidth', 2 and axis tight in your plot (Use '-' linestyle and color the line black) Release the figure by typing hold off Part (b) Compute a = and b = c (where c, and are the values you found in part (a)). Store the values in the variables a and b respectively. . Enter figure to open a new figure. plot the original data points and y (lower case y) (Use 'o' to plot points) Define a vector q that starts at 0 and ends at 25 with increments of 0.1. . Use the vector q to compute the exponential fit y=ae and store it in the variable fitz plot fit2 vs q together with the original data points. (Use red color to plot the line) Part (c) Use the linear model and the values of c, and c computed in part (a) to determine the value ofr when the balance will reach $30,000. Store the result in the variable T. Hint: Note that y represents the balance in thousand of dollars and Y = In y. What should you substitute for Y in the linear fit to represent a balance of $30,000? Make sure you click on Run Script before you submit so you can check for syntax errors. Don't forget to include your name in the first editable line of the script.
Step by Step Solution
★★★★★
3.50 Rating (160 Votes )
There are 3 Steps involved in it
Step: 1

Get Instant Access to Expert-Tailored Solutions
See step-by-step solutions with expert insights and AI powered tools for academic success
Step: 2

Step: 3

Ace Your Homework with AI
Get the answers you need in no time with our AI-driven, step-by-step assistance
Get Started


